Custom Charts in Excel with MarketXLS
Create custom, interactive charts in Excel using any data set with MarketXLS's optimized charting tools.
Super Easy to Use
Custom Charts with MarketXLS
How to Create Custom Charts
Simply click on any data series and click on the chart buttons on the menu. Unlike normal Excel charts, MarketXLS charts try to figure out what your data table has and then plot each series as it goes along columns from left to right. If there is a date column it will automatically plot the date and time series on the x-axis. So, these charts are optimized for time series plotting. Also, the charts have crosshairs and they can be zoomed in and out by using mouse scroll.
No Need for Precise Selection
Example Data and Chart
So, let's say for example you have a data table like below:
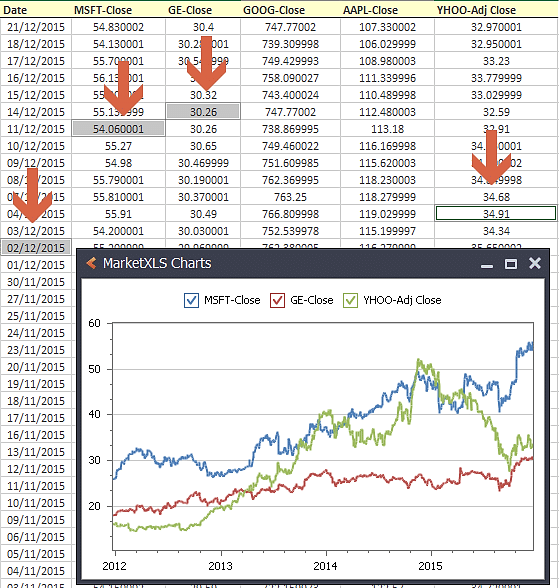
Chart Interaction Features
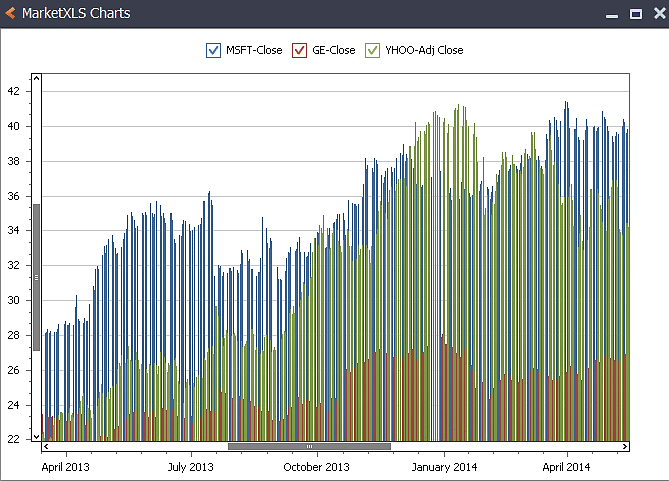
Scroll to Zoom
Use your mouse scroll button with SHIFT to scroll in or out of the charts.
Drag to Zoom
Click on Shift and drag the mouse pointer to Zoom in or out of any chart.
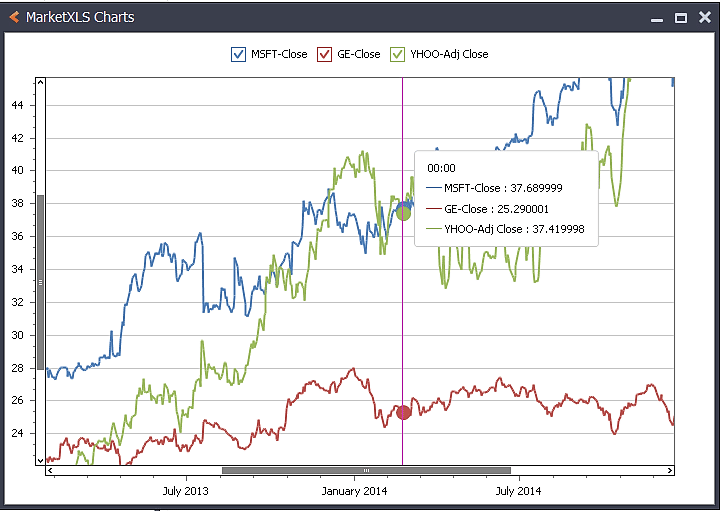
Crosshairs
Charts include interactive crosshairs for precise data point inspection.
Key Features
- Automatic Date Detection: Automatically plots date/time on x-axis when detected
- Time Series Optimized: Designed specifically for financial time series data
- Interactive Zoom: Use mouse scroll or drag to zoom in/out
- Crosshair Support: Precise data point inspection
- Flexible Selection: Select any cells, don't need contiguous ranges
- Multi-series Support: Plot multiple data series on one chart