Overview
The Long Put Synthetic Straddle is implemented by buying the underlying stock and then buying at-the-money puts to cover twice the number of shares purchased. That is, for every 100 shares purchased, 2 put positions must be bought.
This is useful when your stock is expected to move down or up strongly and you want to profit both ways without selling your stocks.
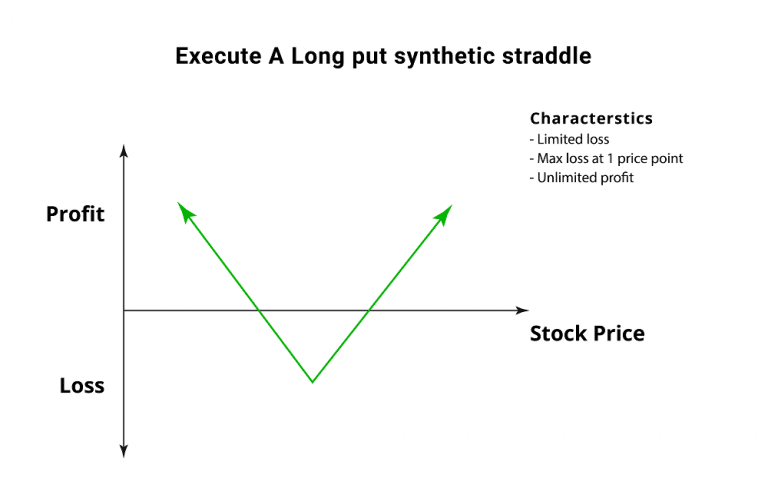
The “V” shaped curve representing the payoff of the Long Put Synthetic Straddle suggests that a significant price move in the underlying asset is a desirable outcome that would lead to a sizeable profit. Hence, a trader who has implemented a Long Put Synthetic Straddle is anticipating increased volatility levels.
Long Put Synthetic Straddle Construction
- Long 100 shares
- Buying 2 ATM Puts
Long put synthetic straddle is a limited risk, unlimited profit options strategy that is used when the trader feels that the underlying security price will experience significant volatility in the near term.
One way is by buying twice as many At The Money (ATM) put options as you have long stocks.
Example: Assume you own 100 shares of ABC company trading at $50 now. To transform the position into Synthetic Straddle, you will buy 2 Put options (representing 200 shares) of ABC at $50.
Profit Potential
Large Profits can be made with the Long Put Synthetic Straddle when the underlying asset price makes a significant move either downwards or upwards at expiration. As long as the underlying asset’s price makes a move above the upside breakeven point or below the downside breakeven point, a profit is realisable.
The formula for calculating profit is:
- Underlying security’s price – net premium paid – purchase price of underlying security
The above formula can be used when the price of the underlying security moves upwards.
- Put exercise price – net premium paid – underlying security’s price
The above formula is to be used when the price of the underlying security moves downwards.
- Maximum Profit = Unlimited
Limited Loss
Maximum loss for the Long Put Synthetic Straddle occurs when the underlying asset price is trading at the strike price of the put options purchased on the expiration date. At this price, both options expire worthless, while the long stock position gains nothing. Hence, the maximum loss equals the net premium paid is incurred by the options trader.
The formula for calculating maximum loss is:
- Max Loss Occurs When Price of Underlying = Strike Price of Long Put
- Max Loss = Net Premium Paid + Commissions Paid
- Maximum Loss = Limited
Traders pay brokerage fees to initiate the trades. Hence, the above formula takes into account the brokerage commissions paid.
The lowest point on the “V” shaped curve represents the corresponding maximum loss of the Long Put Synthetic Straddle.
Breakeven Points
There are 2 break-even points for the Long Put Synthetic Straddle position:
- Lower Breakeven Point = Strike Price of Long Put – Net Debit
- Upper Breakeven Point = Purchase Price of Underlying + Net Debit
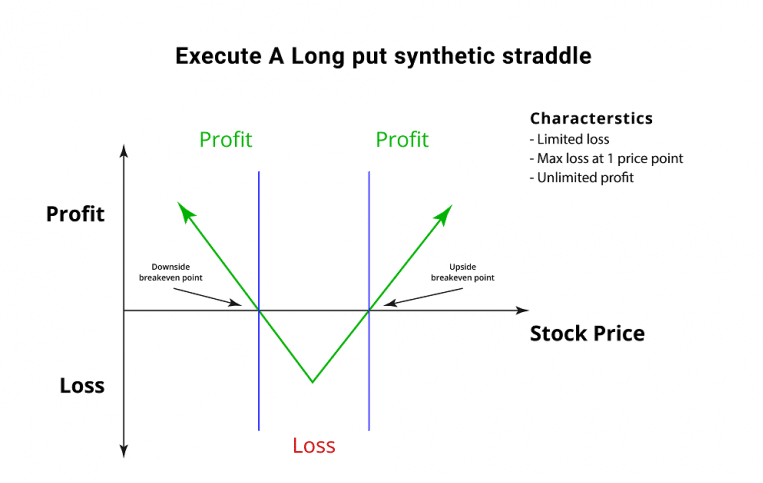
After the break-even points are calculated, the trader can understand that the profit zones are to the left and right of the breakeven points.
Applying Long Put Synthetic Straddle strategy using MarketXLS Template with an example:
MarketXLS software is a one-stop solution for the analysis of your entire investments. It provides a host of functions like eps, various ratios, key fundamentals, historical data, options pricing and much more to assess the value of your investments. It provides a variety of templates for various options trading strategies and also to compare your portfolio stocks for doing a better analysis of your investments.
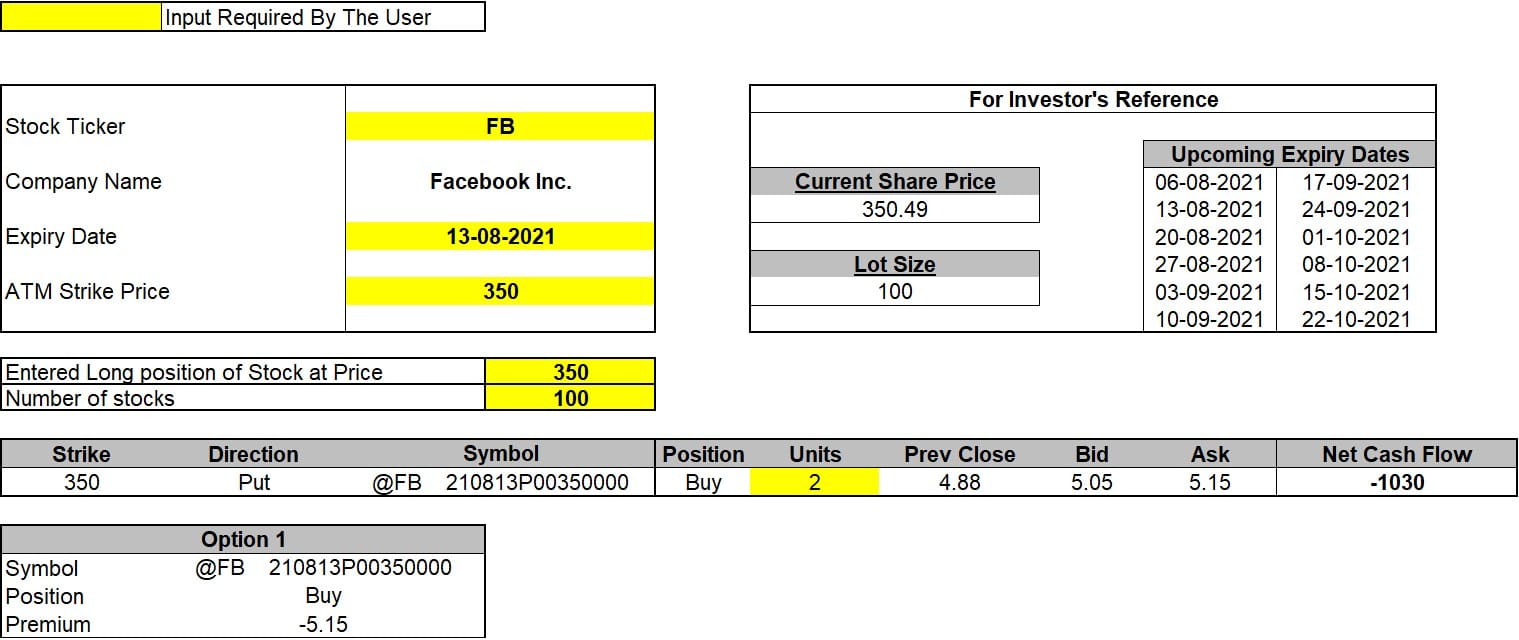
Step 1: Enter the stock ticker in cell D6 and press enter. The template will provide the upcoming expiry dates for the stock and the current market price. Select any one of the expiry dates.
Link to the template: https://marketxls.com/template/long-put-synthetic-straddle/
Step 2: Enter the ATM strike price for Put options bought in cell D12.
Step 3: Enter the long position strike price in cell E15 and the subsequent number of shares in cell E16.
Step 4: Enter the number of Put options bought in cell G19.
Step 5: The template might ask you to refresh. Go to the MarketXLS tab in the ribbon > Refresh All. Click on Refresh All.
The template uses the bid price for sells and ask price for buys to calculate the amount of premium to be paid by you.
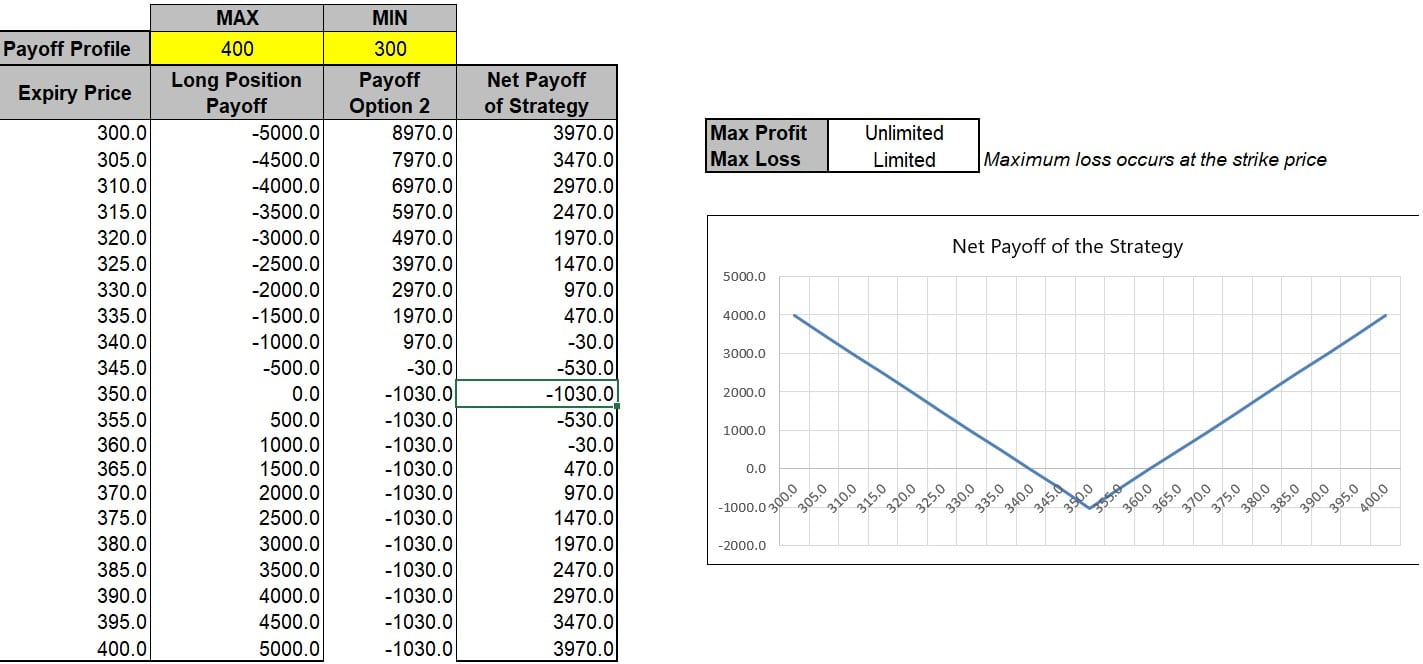
Step 6: The template also provides the Net Payoff Profile of the strategy. You need to enter the expected minimum and maximum expiry prices for the period. It will calculate the net profit or net loss for all the levels of expiry prices for all the options positions and present it graphically.
Facebook (FB) as an example in the above template:
FB stock is trading at levels of $350 on 3rd August, 2021. I have selected the upcoming expiry of 13th August, 2021 to enter the trade. I expect the stock price to move significantly in either direction in the near term, so I want to execute this Long Put Synthetic Straddle strategy by buying 100 shares @$350 strike price and simultaneously buying 2 Put options @$350.
The template will calculate the premium amount for the options and thus calculate the net cash flow for entering the trade, which is $1030 debit in this case.
[ 2*100*5.15 ($350 strike) = -$1030 ]
Suppose if the stock plunges to $330 on expiration, then the Put options will expire in money with an intrinsic value of $4000. But the long position suffers a loss of $2000. Taking into account the initial debit of $1030, my net profit will be $970. This profit will be higher if the stock price drops any further.
Suppose if the stock price soars to $370 on expiration, then the long position will gain $2000 while the Put options expire worthless. Considering the initial debit of $1030, my net profit will again come to $970. This profit will be higher if the stock price rises any further.
Suppose if the stock price keeps trading at $350 on expiration, both the Put options will expire worthless and the long position will break even. Here I will suffer a maximum loss of $1030 which is equal to the net premium paid while entering the trade.
Here is a video explaining Long Put Synthetic Straddle using MarketXLS:
Bottom Line
This strategy is used when one expects a stock to have increased volatility, in either direction.
Using the Long Put Synthetic Straddle strategy, the trader can immediately transform a stock position into an options trading position that profits from either direction without closing the original stock position. Also, only 1 leg is involved, so commission charges are low.
The Long Put Synthetic Straddle is an expensive strategy because we are buying stock to counteract the long puts. It requires a large net debit.
For ease of understanding, the calculations in the above examples did not take into account commission charges as they are relatively small amounts and vary across option brokerages.
However, for active options traders, commissions can impact a significant portion of their profits in the long run. If you trade options regularly, it is wise to select a low commissions broker.
Disclaimer
All trademarks referenced are the property of their respective owners. Other trademarks and trade names may be used in this document to refer to either the entity claiming the marks and names or their products. MarketXLS disclaims any proprietary interest in trademarks and trade names other than its own, or affiliation with the trademark owners.
Reference
https://www.theoptionsguide.com/long-put-synthetic-straddle.aspx
Image Source
https://optionsmanual.com/synthetic-positions/execute-a-long-put-synthetic-straddle/
