Maximizing Returns and Minimize Risk from Portfolio Optimization – with MarketXLS

Meet The Ultimate Excel Solution for Investors
- Live Streaming Prices Prices in your Excel
- All historical (intraday) data in your Excel
- Real time option greeks and analytics in your Excel
- Leading data in Excel service for Investment Managers, RIAs, Asset Managers, Financial Analysts, and Individual Investors.
- Easy to use with formulas and pre-made sheets
Why Excel can be the best tool to manage and optimize an investor’s portfolio?
Excel can be the best tool for portfolio management and optimization due to its easy-to-use features, data analysis, and visualization capabilities. With Excel, investors can make use of a portfolio optimizer tool to conduct portfolio optimization, analyze existing portfolios, backtest portfolios, build asset class allocation models, evaluate investment performance, and determine portfolio risk measures.
Optimal portfolio is an important part of portfolio optimization that helps investors to select assets that maximize returns for a given level of risk. Conditional value at risk is a measure used to evaluate risk that quantifies the expected loss in the worst-case scenario. If an investor’s portfolio performs poorly, they may lose money.
Excel can also help investors identify market opportunities and selecting assets that are expected to provide the best returns. Additional unit can be added to the portfolio to increase diversification and manage risk.
Real estate is an important asset class that can be included in a long-term investment strategy. With Excel, investors can analyze risk and return of portfolio assets using mean-variance analysis, Sharpe ratio and risk factor allocation, line method, integer programming, and the efficient frontier that determines the optimum asset allocation based on asset returns, risk aversion, correlations, return distributions, variance optimization, and utility-maximization problem for the investor.
Excel’s asset allocation calculators, asset class allocation models, risk parity, risk factor allocation fund, and money market can be used to make sound decisions on portfolio reviews, value-at-risk, constraints, and asset selection. Factors like risk tolerance, tracking error, volatility, diversification, taxes, transaction costs, and objective functions can also be managed on Excel with asset weights, mutual fund separation theorem, risk parity, and Covariance matrix for more accurate portfolio return and investment management. Overall, Excel is a powerful tool for investors looking to optimize their portfolio and make sound investment decisions for the long term.
What is modern portfolio theory?
Modern Portfolio Theory (MPT) is a popular financial and investment concept that advocates diversification of an investor’s portfolio to maximize expected returns while limiting risk. The theory is based on the assumption that the construction of a portfolio from a diversified set of assets minimizes the correlation between their returns. The Covariance Matrix is used to calculate the expected return and risk of the portfolio, and the Sharpe Ratio is used to compare different portfolios and identify the most efficient one.
Risk-free assets depend on the optimization process, which aims to balance the allocation of risky assets with the allocation of risk-free assets. MPT uses financial instruments such as asset classes, portfolio optimizer tools, and risk measures to create an optimal mix of investments tailored to the investor’s unique investment preferences and risk tolerance.
Return data plays a significant role in optimizing portfolios, and MPT uses methods such as mean-variance analysis and dataframe to analyze and compare various portfolios by calculating the expected return, variance, and standard deviation. The Markowitz method is a well-known approach to optimizing portfolios using MPT, which involves identifying the maximum Sharpe Ratio, which represents the optimal combination of risky and risk-free assets.
When using MPT, investors must consider outside factors such as taxes, investor utility function, and risk aversion to better understand the utility-maximization problem. Historical returns and average return are also important factors in determining the most profitable portfolio that makes the most money.
MPT also uses advanced mathematical models such as Gaussian copula to measure risk and estimate portfolio performance. John Wiley & Sons is a leading publisher of books and journals on MPT and other financial concepts. Overall, Modern Portfolio Theory is a powerful and widely used tool in the world of investment and financial risk management and is an invaluable asset for any investor looking to get the most out of their portfolio.
What is efficient frontier and how do you use it to optimize a portfolio?
Efficient Frontier is an important tool used to optimize a portfolio. It is a graphical representation of the optimal portfolio combination (weight of different assets) that maximizes returns with a desired level of risk. Its usage is based on Modern Portfolio Theory, which defines a portfolio combining multiple asset classes such as stocks, bonds, commodities, mutual funds, and so on.
Different types of portfolio optimization strategies, such as weight-based, mean-variance optimization, and integer programming, can help to solve the various constraints of the efficient frontier and can be used to create a data frame of individual asset returns and correlations. This information is then used to calculate a covariance matrix and a portfolio return.
The risk-return trade-off is a key concept in portfolio optimization, as investors aim to maximize returns while minimizing risk. Joint distribution is used to model stock returns over discrete time periods, and it is a key input in the mean-variance optimization process.
Efficient Frontier can help investors to achieve the highest possible return for a given level of risk. By using the highest return that a portfolio can generate, investors can determine the optimal asset allocation that provides the highest return with the lowest possible risk.
Different types of risk measures, such as risk aversion, value-at-risk, tracking error, volatility, and Sharpe ratio, can be used to effectively backtest portfolios and assess the impact of taxes, transaction costs, and risk factor allocations on portfolio performance.
Utilizing a portfolio optimizer tool, such as MarketXLS and Portfolio Optimization Excel, investors can effectively utilize the efficient frontier to make optimal portfolio adjustments, reduce risk, improve return, and achieve maximum utility for their specified investment preferences.
Which model is best for portfolio optimization?
Portfolio optimization is a key step in investment management, and it is essential to look into different approaches to make the best decisions. The aim is to create an optimized portfolio with the lowest possible risk while maximizing portfolio returns.
Risk-free assets are often included in an optimized portfolio to reduce tail risk, which is the risk of an extreme event that is unlikely to occur. Financial modeling is used to analyze and optimize portfolio performance, taking into account different factors such as asset classes, stock prices, and asset returns.
There is a trade-off between risk and return in portfolio optimization, and it is important to balance these factors to achieve the best results. The variance approach is one approach to optimizing a portfolio by minimizing the variance of portfolio returns. Another approach is to maximize the Sharpe ratio, which measures the risk-adjusted return of a portfolio.
The feasible set is a set of portfolios that satisfy certain constraints, such as asset allocation limits and risk levels. Several studies have shown that different optimization strategies can lead to different feasible sets, and it is important to choose the strategy that best suits your investment preferences.
Both the mean-variance and risk parity models are widely used in portfolio optimization, and they have their own strengths and weaknesses. The mean-variance model tries to minimize risk by creating an optimized asset allocation, while the risk parity model takes into account correlations between asset classes to create a more balanced portfolio. Short-term investment strategies may prefer mean-variance optimization, while long-term investment strategies may prefer risk parity optimization.
For more information about the advantages and disadvantages of each of these models, you can visit Maximize Your Portfolio Performance with Efficient Frontier, Portfolio Optimization – Excel to the Rescue, and Leveraging AI for Portfolio Optimization in Excel.
How can MarketXLS help
MarketXLS helps investors with portfolio management by optimizing their investment portfolio in the most efficient way. Its portfolio optimizer tool delivers sophisticated algorithms and timely updates on relevant data affecting portfolio performance.
Investors can apply different approaches to implement the best asset allocation that achieves their investment goal with the least amount of risk and the best return. The portfolio weights can be optimized by setting an objective function that maximizes portfolio value while minimizing risk. Efficient portfolios can be constructed by using different optimization models, such as mean-variance optimization, risk parity, or stochastic optimization.
MarketXLS’ portfolio optimizer allows users to easily backtest their portfolio and make instant adjustments. It calculates the relevant risk profile and enables users to analyze their portfolios by assessing risks, expected returns, and building a diversified portfolio by asset class.
Investors can also analyze the performance of private companies by using conditional value at risk, which quantifies the expected loss in the worst-case scenario. MarketXLS’ asset-allocation calculator helps investors construct allocations that maximize their Sharpe ratio, VaR, Sortino ratio, tracking errors, and correlations.
With its coverage of investment preferences and methods, such as mean-variance analysis, utility functions, and stochastic portfolio theory, investors can limit their portfolio’s exposure to investment risk by using MarketXLS’ asset allocation calculator, risk-factor allocation functions, and portfolio reviews.
Investors who use MarketXLS’ portfolio optimizer are able to create sophisticated, optimized portfolios that take into account transaction costs, taxes, and investor utility function. In all, MarketXLS provides investors with the tools needed for portfolio optimization by offering useful features, including calculators, dataframes, risk measures, returns, and asset classes. With MarketXLS, investors can create suitable portfolios that attenuate their risk and maximize their return. Short selling can also be taken into consideration to further enhance the efficiency of the portfolio.
Relevant MarketXLS functions on this topic
| Function Title | Function Example | Function Result |
|---|---|---|
| Portfolio Efficient Frontier Chart | =PortfolioEfficientFrontierChart(A3:B10) | It brings up a chart that shows the set of portfolios which satisfy the condition that no other portfolio exists with a higher expected return but with the same standard deviation of return. |
| Portfolio Efficient Frontier Data | =PortfolioEfficientFrontierData(A3:B10) | It is the set of portfolios which satisfy the condition that no other portfolio exists with a higher expected return but with the same standard deviation of return. |
| Maximum Drawdown | =MaximumDrawdowns(A3:B10) | It is the maximum observed loss from a peak to a trough of a portfolio, before a new peak is attained. Maximum drawdown is an indicator of downside risk over a specified time period. |
| Portfolio Beta | =PortfolioBeta(A3:B10) | Beta is a measure of the volatility—or systematic risk—of a portfolio compared to the market as a whole |
Use AI driven search for all functions on MarketXLS here: https://marketxls.com/functions
Download from the link below, a sample spreadsheet created with MarketXLS Spreadsheet builder
https://mxls-templates.s3.us-west-2.amazonaws.com/MarketXLS-Model-ID-Ltn0y4.xlsx
Note this spreadsheet will pull latest data if you have MarketXLS installed. If you do not have MarketXLS consider subscribing here
Relevant MarketXLS Templates on this topic
| Template Title | Template Link | Screenshot |
|---|---|---|
| Portfolio comparison template | https://marketxls.com/template/portfolio-comparison-template | 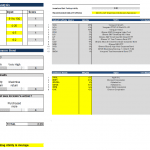 alt="Maximizing Returns and Minimize Risk from Portfolio Optimization – with MarketXLS"> alt="Maximizing Returns and Minimize Risk from Portfolio Optimization – with MarketXLS"> |
| Cathie Wood vs User Portfolio Strategy | https://marketxls.com/template/cathie-wood-vs-user-portfolio-strategy | 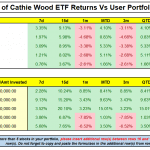 alt="Maximizing Returns and Minimize Risk from Portfolio Optimization – with MarketXLS"> alt="Maximizing Returns and Minimize Risk from Portfolio Optimization – with MarketXLS"> |
| Correlation Matrix R | https://marketxls.com/template/correlation-matrix-r | 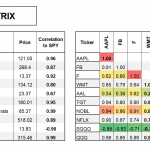 alt="Maximizing Returns and Minimize Risk from Portfolio Optimization – with MarketXLS"> alt="Maximizing Returns and Minimize Risk from Portfolio Optimization – with MarketXLS"> |
| Kirkpatrick Value Screen | https://marketxls.com/template/kirkpatrick-value-screen | 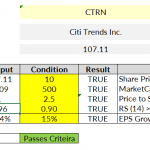 alt="Maximizing Returns and Minimize Risk from Portfolio Optimization – with MarketXLS"> alt="Maximizing Returns and Minimize Risk from Portfolio Optimization – with MarketXLS"> |
| Kirkpatrick Growth Screen | https://marketxls.com/template/kirkpatrick-growth-screen | 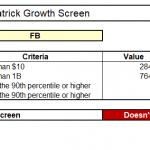 alt="Maximizing Returns and Minimize Risk from Portfolio Optimization – with MarketXLS"> alt="Maximizing Returns and Minimize Risk from Portfolio Optimization – with MarketXLS"> |
| O’Shaughnessy: All Cap Screen | https://marketxls.com/template/oshaughnessy-all-cap-screen | 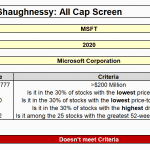 alt="Maximizing Returns and Minimize Risk from Portfolio Optimization – with MarketXLS"> alt="Maximizing Returns and Minimize Risk from Portfolio Optimization – with MarketXLS"> |
| Returns Analysis – MTD, YTD, 3 month | https://marketxls.com/template/returns-analysis-mtd-ytd-3-month-2 | 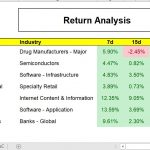 alt="Maximizing Returns and Minimize Risk from Portfolio Optimization – with MarketXLS"> alt="Maximizing Returns and Minimize Risk from Portfolio Optimization – with MarketXLS"> |
Use AI driven Search for all templates on MarketXLS here: https://marketxls.com/templates/
Relevant blogs that you can read to learn more about the topic
Using MarketXLS for Portfolio Optimization to Maximize Returns
Maximize Your Portfolio Performance with Efficient Frontier
Leveraging AI for Portfolio Optimization

I invite you to book a demo with me or my team to save time, enhance your investment research, and streamline your workflows.