
Introduction
## Unlock the Power of Excel: How to Get Option Data with MarketXLS
Have you ever wished for a more efficient way to get option data in Excel? With MarketXLS, it’s possible. This guide will walk you through the steps to achieve this, offering easy-to-understand instructions and practical examples. From pulling historical data to creating dynamic stock lists and using powerful financial and technical analysis tools, MarketXLS brings a wealth of features right into your Excel workspace. Whether you’re a seasoned trader or just starting out, you’ll find valuable tips to enhance your data analysis. Ready to simplify your workflow and get the most out of Excel? Let’s dive in!
How to get data option in Excel?
To get data options in Excel using MarketXLS, you have access to a rich set of features and functions available within the MarketXLS add-in. Here’s how you can access and utilize these data options effectively:
Historical Data
1. **1 Year Close **: Pull a quick one-year history of prices for your ticker. You can select different timeframes from the dropdown provided.
– To access one-year historical pricing:
=HISTORY("MSFT", "close", TODAY()-365, TODAY())
2. Custom Dates: This option allows you to control the custom time frame for your historical data. Select a ticker or a group of tickers in Excel. Then, choose your dates and click on “Get Data” to create a new sheet with all the historical data.
– Example function:
=HISTORY("MSFT", "close", "2022-01-01", "2022-12-31")
Stock Lists
3. Stock Lists: This section includes various lists such as your watchlists, watchlists shared with you, or pre-built stock lists made by analysts (e.g., SP500, Cryptos, Russell 2000, Stocks under $10, Daily Movers, etc.).
– Manage your lists using MarketXLS menu or functions to dynamically load and update your lists.
Popular Functions
4. MarketXLS Functions: A curated list of popular functions from different categories. Clicking on a function in this section auto-populates the function and its default arguments in Excel.
– Example:
=QM_Last("MSFT")
Financial and Technical Analysis
5. Financial Statements: Download financial statement data of companies by selecting the stock and choosing the required financial button.
– Example:
=cf_annual_financials("MSFT", "2022", "TotalRevenue")
6. Technical Indicators: Calculate technical indicators from historical data within your sheets. MarketXLS offers more than 100 technical indicators.
– Example for Moving Average:
=TR_MovingAverage("MSFT", "2022-01-01", "2022-12-31", 50)
Filtering and Screening
7. Filters: Use stock and option screeners to shortlist stocks that meet your screening criteria.
– Example for filtering stocks:
=StockScreener("criteria here")
Charts
8. Charts: Create ready-made stock charts, customize your charts, add panels, in-built indicators, multiple axes, and more.
– Example to create a chart:
Select data -> MarketXLS Menu -> Chart Options
Other Utilities
9. Utilities: Includes options like Option Symbol Converter, getting option chains, symbols by earnings date, Twitter integration, and more.
– Example for retrieving option chains:
=qm_option_chains("MSFT")
Search
10. Search: Utilize AI-driven search functionality to search from thousands of MarketXLS functions and downloadable templates.
– Example search term in MarketXLS:
Moving Average
Settings and Help
11. Settings/Help: Access settings and help options, including your license information, license expiry, and third-party user credentials for data subscriptions.
– Navigate to:
MarketXLS Menu -> Settings/Help -> Settings
These features are designed to help you maximize the efficiency and effectiveness of your data analysis in Excel using MarketXLS.
Here is the template you might want to check out and MarketXLS has 100s of templates to get you started easily and save you time.
– ** Template Name: Portfolio Management (RBSandiego)–Portfolio Management (RBSandiego)**–Image:
Portfolio Management (RBSandiego)
For more information on using specific functions, you can check out details on their websites or user guides.
Best Excel templates for managing options data
Here are some of the best Excel templates for managing options data using MarketXLS:
1. ** Options Strategy Templates:**– These templates are designed for various options trading strategies. They include predefined setups for common strategies like covered calls, iron condors, straddles, and more.
– You can find templates specifically tailored for strategies and execute them directly within Excel.
2.** Options Profit Calculator:**– A powerful tool for estimating potential profits or losses on any options trade by considering factors like the underlying stock price, strike price, and option expiration date.
– Key features include options chain filtering, configuring up to 8 legs per trade, and payoff & results customization.
– You can save your configurations and scanning criteria for future use .
3.** Market Scan Functions:**– These templates help you scan the market for unusual options activities. Functions like =opt_UnusualOptionOIScanEOD(10) and =opt_UnusualOptionVolOIScanEOD(10) identify underlyings with significant open interest and volume changes.
– Templates for scanning market options can quickly identify options with the highest volume or open interest changes .
4.** Historical Data Analysis:**– Retrieve complete historical option chains to backtest strategies.
– Examples include =opt_HistoricalOptionChain("Ticker","Date") to get data-points like bid, ask, delta, gamma, vega, theta, rho, and implied volatility for historical dates .
5.** Option Utility Functions:**– Create real-time option chains with the precise strikes and expirations needed using functions like =opt_StrikeNext("Symbol", 2, ExpirationNext("Symbol")).
– These templates allow dynamic fetching and updating of strike prices for specific expirations.
6.** Average Volume and Open Interest:**– Functions like =opt_VolumeOptionsAverage("MSFT", 5) help explore average trading volumes for options.
– Templates include metrics for assessing option contracts with high open interest and volume ratios .
These templates incorporate a wide array of MarketXLS functions that help organize and analyze options data effectively, allowing for a comprehensive approach to options management and strategy testing. You can download many of these templates directly through the MarketXLS tool panel integrated into Excel .
Here is the template you might want to checkout and MarketXLS has 100s of templates to get you started easily and save you time.
Option Chain Excel Sheet (SPY Example)
Option Chain Excel Sheet (SPY Example)
Real-time data connections for Excel option data
MarketXLS provides robust capabilities to get real-time options data in Excel. Here’s an overview of the features and steps to set it up:
Key Features for Real-Time Options Data
1.Stream Live Stocks Data:
– Allows real-time streaming of stocks data in Excel.
2. Real-Time Stock Options Price:
– Provides the ability to fetch real-time stock options prices enabling faster investment decisions.
3. Options Filtering and Scanning:
– Tools available for filtering and scanning various options based on specific criteria.
4. Historical Stock and Options Data:
– Retrieve historical data to analyze past performance.
5. Track and Manage Portfolio:
– Integration within Excel to manage your portfolio and track real-time performance.
Setting Up Real-Time Data Connection
1. ** Subscription with Quotemedia**:
– Real-time data, including options data, requires a Quotemedia subscription. This is integrated with various MarketXLS plans.
• Steps**:
– Enter your Quotemedia account credentials in MarketXLS:
MarketXLS Menu >> Settings/Help >> Settings >> Data Subscriptions >> Quotemedia Tab
Username: your_usernamePassword: your_password
– Test the connection to ensure it is correctly set up.
– After successful connection, you can start using various functions to fetch options data. For example:
=qm_getOptionChain("Stock Symbol")
– **Streaming Data Features **:
– Refresh functionalities such as Refresh All, Refresh Selected, 5 Min Refresh, and Streaming On/Off to control how and when data is updated in your sheets.
Useful Functions & Features
– Option Functions:
– Functions like =qm_getOptionChain("Stock Symbol") for getting the options chain of a stock.
– Black-Scholes model for dynamic option pricing available within the tool.
– Options Profit Calculator:
– Offers web-based functionalities that use your existing Excel account.
– It includes features like options chain filtering, theoretical value calculation using the Black-Scholes model, multi-leg option strategy analysis, and more.
Additional Tools
– Tradier Integration:
– Execute trades directly from Excel using Tradier.
– Two modes are available: Single Leg Trades and Multi-Leg Trades.
– Use formulas such as:
=TradeSingleLegTradier()
– Follow the steps for inserting trade details and executing trades directly from Excel.
Resources and Tutorials
– Video Tutorials:
– MarketXLS provides video tutorials covering various functionalities, including setup and usage of the options scanner, historical pricing, etc.
– Webinars:
– Attend webinars to learn about technical indicators and custom screening using MarketXLS functions.
Contact and Support
– If there are any issues or further assistance is needed, MarketXLS support can be contacted via:
– Email: support@marketxls.com .
By following these steps and leveraging the tools provided by MarketXLS, you can efficiently manage and analyze real-time options data directly in Excel.
Here is the template you might want to checkout and marketxls has 100s of templates to get you started easily and save you time:
–

Template Image
Different Sources for Option Data
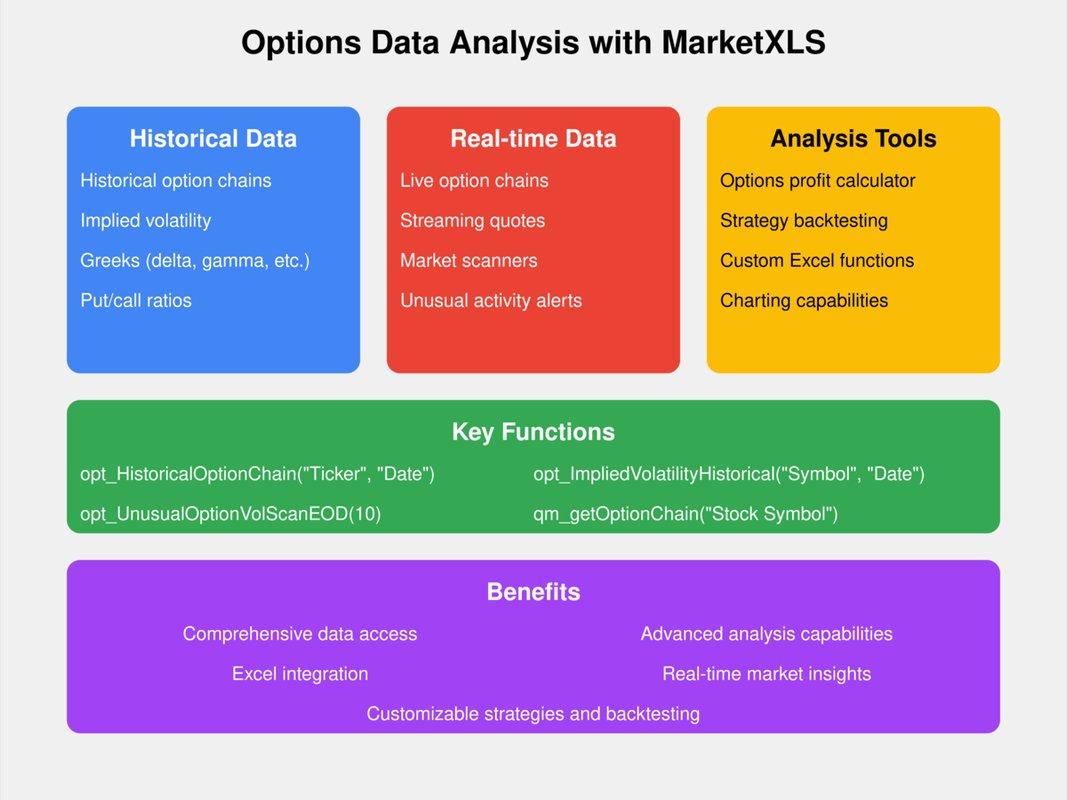
MarketXLS offers a variety of data sources and functionalities for option data that can help users in analyzing options and their market activities. Here are the primary sources and functionalities available within MarketXLS for acquiring and analyzing option data:
1. Historical Option Data:
– Retrieve historical option chains using the function =opt_HistoricalOptionChain("Ticker", "Date"). This function provides the entire option chain for a specified expiration date, allowing for a detailed analysis and backtesting of strategies.
– You can also access other historical data points like implied volatility using =opt_ImpliedVolatilityHistorical("Symbol", "Date").
2. Option Order Flow Summary Functions:
– Functions are available to understand the total volume and open interest of options traded for a specific underlying. For example, the function =opt_TotalVolumeOptions("Symbol", "P", ExpirationNext("Symbol")) returns the total volume of options traded for an underlying with a specific expiry and type (call/put).
– Historical put/call ratios can be obtained using =opt_PutCallVolRatioHistorical("Symbol", "Date").
3. Market Scans for Unusual Activities:
– MarketXLS provides several functions to scan for unusual option market activities:
– =opt_UnusualOptionOIScanEOD(10) for spotting underlyings with the highest change in open interest compared to the previous day.
– =opt_UnusualOptionVolScanEOD(10) to identify underlyings with the highest option trading volumes.
– =opt_UnusualOptionVolOIScanEOD(10) for identifying underlyings exhibiting high volume-to-open interest ratios.
– The =opt_UnusualStockOptionsActivity(5) function helps in finding specific options with the highest volume/open interest ratio.
– Functions like =opt_OptionsChangeInOILeaders(5) provide options undergoing the most significant OI changes from the previous day.
– Volume leaders can be highlighted using =opt_OptionsVolumeLeaders(5), and =opt_OptionsChangeInVolumeLeaders(5) offers insights into options with the most significant volume changes from the day before.
4. ** Real-Time Data**:
– Integration with third-party services like QuoteMedia enables real-time option data retrieval, which is crucial for trading strategies requiring current market data.
These functionalities enable MarketXLS users to conduct comprehensive options analysis, develop and backtest trading strategies, and identify market opportunities efficiently. MarketXLS’s integration and real-time data capabilities ensure that users have access to a wide array of data points suitable for various levels of options trading needs.
Here is the template you might want to checkout and MarketXLS has 100s of templates to get you started easily and save you time.
• Template for Accessing Real-Time Data on US Stock Option Bids, Greeks, Open Interest, and Unusual Option Volume**:
Template Image
Happy analyzing!
Historical Option Data Analysis in Excel
MarketXLS provides various functions for historical option data analysis in Excel. Here are the key functions and their details:
1. Historical Option Data Functions
MarketXLS offers several functions to fetch historical options data. These functions can retrieve data points like bid, ask, delta, gamma, vega, theta, rho, and implied volatility for past dates. This information is essential for backtesting trading strategies and performance analysis.
Function Examples:
– =opt_ImpliedVolatilityHistorical("Option Symbol", "YYYY-MM-DD"): Fetches the implied volatility for an option on a specified historical date.
– =opt_RhoHistorical("Option Symbol", "YYYY-MM-DD"): Returns the rho for an option on a specific date.
– =opt_VegaHistorical("Option Symbol", "YYYY-MM-DD"): Returns the vega for an option on a specific date.
– =opt_DeltaHistorical("Option Symbol", "YYYY-MM-DD"): Retrieves the delta value for an option on a historical date.
– =Bid_Historical("Option Symbol", "YYYY-MM-DD"): Gets the bid price for an option on a specific historical date.
– =Ask_Historical("Option Symbol", "YYYY-MM-DD"): Fetches the ask price for an option on a specified date .
2. Option Chains and Order Flow Functions
MarketXLS also provides functions to retrieve historical option chains and summarize options order flow data.
Function Examples:
– =opt_HistoricalOptionChain("Ticker", "YYYY-MM-DD"): This function provides the entire option chain for a specified expiration date. It is useful for in-depth historical data analysis and backtesting strategies.
3. Market Scans and Unusual Activity
There are several scanning functions to identify unusual option activities based on volume and open interest.
Function Examples:
– =opt_UnusualOptionOIScanEOD(10): Identifies the top 10 underlying assets with the most significant open interest change from the previous day.
– =opt_UnusualOptionVolScanEOD(10): Finds the 10 underlying assets with the highest options volume.
– =opt_UnusualOptionVolOIScanEOD(10): Shows the underlying assets with the highest volume to open interest ratio.
– =opt_UnusualStockOptionsActivity(5): Tracks options with the highest volume/open interest ratio.
These functions can greatly enhance your ability to perform detailed historical data analysis, helping you make more informed trading decisions.
Here is the template you might want to checkout and MarketXLS has 100s of templates to get you started easily and save you time.
• Historical IV Calculator**– This template helps investors gauge the risk exposure of an option with a given strike and expiry date. The historical volatility can also be calculated.
Link: Historical IV Calculator
Image:

Historical IV Calculator
Backtesting Option Strategies in Excel
Backtesting Option Strategies with MarketXLS in Excel
To backtest option strategies in Excel using MarketXLS, follow these steps and leverage the various functions provided by the software:
Step 1: Retrieve Historical Option Data
Use the =opt_HistoricalOptionChain("Ticker", "Date") function to retrieve past option chains for a particular ticker on a specified expiration date. This data includes the bid, ask, delta, gamma, vega, theta, rho, and implied volatility, which are crucial for evaluating historical performance and strategies.
–**Example **:
=opt_HistoricalOptionChain("AAPL", "2023-01-01")
This function will fetch the entire option chain for Apple Inc. on January 1, 2023.
Step 2: Analyze Historical Option Data
Use other supportive functions to extract specific historical metrics:
– =opt_ImpliedVolatilityHistorical("Ticker", "Date") provides the implied volatility for an option on a specified historical date.
– =opt_TotalVolumeOptions("Ticker", "Call", ExpirationNext("Ticker")) returns the total volume of call options traded for the underlying with a specific expiry and option type.
– =opt_PutCallVolRatioHistorical("Ticker", "Date") delivers the put-call volume ratio for an underlying on a historical date.
Step 3: Define Your Option Strategy
Configure your options strategy by specifying the parameters of the options you plan to buy or sell. You may need to combine multiple legs of options trades to mimic complex strategies like spreads, straddles, or strangles.
– Example:
Suppose you’re analyzing a simple call buying strategy and a covered call strategy on historical data:
-- Calculate the payoff from a single call option:Call_Payoff = MAX(0, Stock_Price - Strike_Price) - Option_Premium-- For a covered call strategy:-- Calculate potential profits by summing up the realized stock price changes and the incoming premiums.Covered_Call_Profit = (Stock_Price - Initial_Stock_Price) + Option_Premium - MAX(0, Stock_Price - Strike_Price)
Step 4: Automate Backtesting with Excel Formulas
Automate the evaluation of your strategy via Excel formulas. Adjust your formulas to iterate across historical data to simulate and aggregate the results of your strategy over time.
– Example:
Create a table with the historical stock prices, and use a formula to compute the payoff for each row of historical data in your table:
=SUMPRODUCT(MAX(0, Historical_Stock_Prices - Strike_Price) - Option_Premiums)
Step 5: Analyze Results
Analyze the results by calculating the aggregate profit/loss, risk metrics, and cumulative performance of your strategies over the historical period evaluated.
Step 6: Refine Your Strategy
Based on the backtesting results, refine your strategy parameters (e.g., changing strike prices, expiration dates, or adjusting the types of options used) to optimize performance.
Additional Tools and Functions
MarketXLS provides several other useful functions for options analysis which can help in both backtesting and live trading:
– Options Order Flow Summary Functions:
– =opt_TotalVolumeOptions("Symbol","P",ExpirationNext("Symbol"))
– =opt_PutCallVolRatioHistorical("Symbol","2023-09-01")
– =opt_ImpliedVolatilityHistorical("Symbol","2023-09-01")
– Market Scan Functions for Tickers and Options:
– =opt_UnusualOptionOIScanEOD(10)
– =opt_UnusualOptionVolScanEOD(10)
– =opt_UnusualOptionVolOIScanEOD(10)
– ** Backtest Accurately with Historical Option Chains**:
– =opt_HistoricalOptionChain("Ticker","Date")
These functions help you understand past market behaviors and fine-tune your strategies .
Note:
Always keep your MarketXLS spreadsheet updated with the latest software version to ensure compatibility and access to the newest functions and features.
By following these steps, you can effectively backtest option trading strategies in Excel using MarketXLS functions, thereby making more informed trading decisions.
Here is the template you might want to checkout and MarketXLS has 100s of templates to get you started easily and save you time.
• Template Link**: [Options Rollover Strategy Example Template – MarketXLS](https://marketxls.com/marketxls-templates/458/options-rollover-strategy-example-template)
option data in excel
option data in excel
Summary
MarketXLS brings extensive options data to Excel. It offers features like historical data retrieval, stock lists, financial and technical analysis, filtering, and chart creation. Users can manage options data easily using Excel.
Key features:
1. **Historical Data**: Retrieve historical prices using formulas like =HISTORY(“MSFT”, “close”, TODAY()-365, TODAY()).
2. **Stock Lists**: Manage watchlists and pre-built stock lists.
3. **Technical Indicators**: Calculate over 100 indicators such as moving averages.
4. **Filtering and Screening**: Use screeners to shortlist stocks.
5. **Option Chains**: Retrieve option chains with =qm_option_chains(“MSFT”).
Templates and real-time data help in efficient options data management.
