

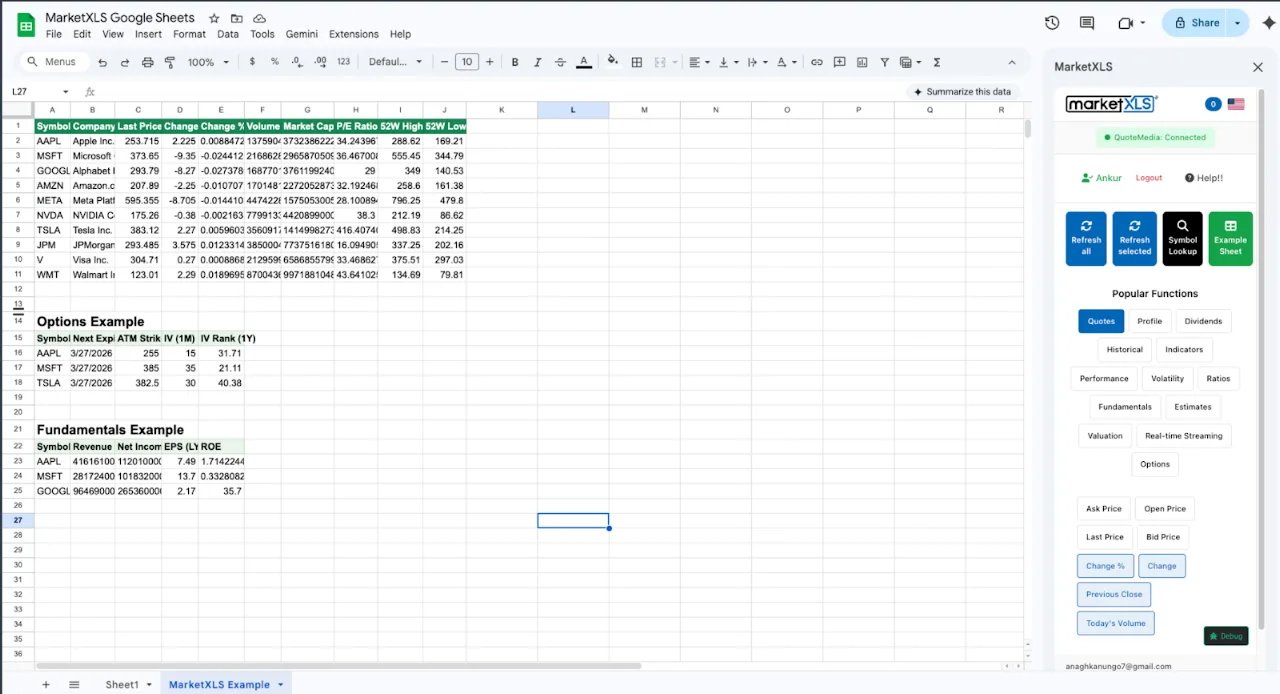
To get an option chain in Google Sheets, install the MarketXLS Google Sheets add-on and type =QM_GetOptionChain("AAPL") in a cell. The formula returns the chain for each expiration and strike, with bid, ask, last, volume, open interest, implied volatility, and Greeks. Google's built-in GOOGLEFINANCE function has no options data at all. Options data is end-of-day on the MarketXLS Standard plan and real-time on the Advanced and Business plans.
Why You Cannot Get Options Data from GOOGLEFINANCE
GOOGLEFINANCE returns basic stock attributes such as price, volume, P/E ratio, and 52-week high/low, but no options fields. There is no =GOOGLEFINANCE("AAPL", "optionchain") or any equivalent.
This means options traders who prefer Google Sheets have been stuck with one of these workarounds:
- Copy and paste from a brokerage or options website (tedious, manual, and stale by the time you finish)
- Write Apps Script code to call an external API (requires programming knowledge and ongoing maintenance)
- Use a third-party API (requires coding and is usually rate limited)
- Give up on Google Sheets and switch to a desktop platform (defeats the purpose of using a spreadsheet)
MarketXLS replaces these workarounds with worksheet formulas.
How to Get Option Chain Data in Google Sheets
Install MarketXLS from the Google Workspace Marketplace, then use a single formula to pull the full options chain:
=QM_GetOptionChain("AAPL")
Formula documentation: QM_GetOptionChain
This returns the options chain for Apple into your spreadsheet, across the available expiration dates and strikes, with the following data for each contract:
- Bid price
- Ask price
- Last traded price
- Volume
- Open interest
- Implied volatility
- Delta, Gamma, Theta, Vega, Rho
Filter Options Chains
You can also filter the options chain to show only specific contracts:
=QM_GetOptionChainAtTheMoney("AAPL")    // At-the-money options only
=QM_GetOptionChainInTheMoney("AAPL")    // In-the-money options only
Formula documentation: QM_GetOptionChainAtTheMoney, QM_GetOptionChainInTheMoney
These filtered views make it easier to focus on the contracts that matter for your strategy.
Options Greeks in Google Sheets
The option chain returned by MarketXLS includes delta, gamma, theta, vega, and rho for each contract. Here is what each Greek measures.
Delta measures how much the option price changes for a $1 move in the underlying stock. A delta of 0.50 means the option price moves roughly $0.50 for every $1 move in the stock.
Gamma measures the rate of change of delta. High gamma means delta is changing quickly, which affects hedging requirements.
Theta measures time decay. Options lose value every day, and theta tells you how much. This is critical for income strategies like covered calls and iron condors.
Vega measures sensitivity to implied volatility changes. When IV spikes or crushes, vega tells you how much your option price will be affected.
Rho measures sensitivity to interest rate changes. Less commonly used but important for longer-dated options.
All of these Greeks are included in the options chain data returned by =QM_GetOptionChain("AAPL"). You do not need to calculate them manually.
Theoretical option pricing in Google Sheets
MarketXLS includes Black-Scholes functions for theoretical option values and Greeks. =BlackScholesOptionValue(Symbol, Strike, DaysToExpiry, Rate, Volatility, CallPut) returns a theoretical value, and functions such as =opt_Delta(...) and =opt_ImpliedVolatility(...) calculate a Greek or implied volatility from inputs you supply. Compare the theoretical value with the market bid and ask from the chain to see whether a contract looks rich or cheap relative to your volatility assumption. Check the formulas page for which pricing functions are available in the Google Sheets add-on.
Put/Call Ratios and Options Analytics in Google Sheets
MarketXLS also returns aggregate options statistics for an underlying:
Put/Call Volume Ratio: The ratio of put volume to call volume for a stock. A high put/call ratio can indicate bearish sentiment.
Put/Call Open Interest Ratio: Similar to the volume ratio but based on open interest, which reflects longer-term positioning.
Historical Implied Volatility: Track how implied volatility has changed over time for a stock.
Historical Greeks: Track how delta, gamma, and other Greeks have changed over time for specific contracts.
Traders use these statistics as sentiment gauges and to monitor risk; they do not predict reversals on their own.
Building an Options Strategy Tracker in Google Sheets
A simple options strategy tracker takes five steps:
Step 1: In cell A1, type =QM_GetOptionChain("AAPL") to pull the full options chain.
Step 2: Identify the contracts you want to track. Note the strike price, expiration date, and whether it is a call or put. =OptionSymbol("AAPL", DATE(2026,12,18), "Call", 250) builds the option symbol from those inputs.
Step 3: In a separate area of your spreadsheet, create a strategy tracker:
| Column | Data |
|---|---|
| A | Strategy name (e.g., "AAPL Bull Call Spread") |
| B | Long leg symbol |
| C | Short leg symbol |
| D | Entry price (long) |
| E | Entry price (short) |
| F | Current price (long) via =QM_Last() |
| G | Current price (short) via =QM_Last() |
| H | P/L calculation |
| I | Days to expiration |
Step 4: Use the stock price data to track your underlying:
=Last("AAPL")              // Current stock price
=ChangeinPercent("AAPL")   // Daily % change
Formula documentation: Last, ChangeinPercent
Step 5: Add risk metrics using the Greeks data from the options chain to monitor delta exposure, theta decay, and vega risk across your positions.
Who Needs Options Data in Google Sheets
Options Traders: Anyone who trades options and prefers the flexibility of Google Sheets over a brokerage platform. Google Sheets lets you build custom analytics, share with trading partners, and access your data from any device.
Financial Advisors: Advisors who run covered call programs, protective put strategies, or collar strategies for client portfolios need options data in a format they can present to clients. A Google Sheets dashboard gives them a shareable format for client meetings.
Quantitative Analysts: Quants who want to prototype options strategies in a spreadsheet before implementing them in code. Google Sheets with MarketXLS provides the data, and the spreadsheet environment makes it easy to test ideas quickly.
Students and Educators: Pulling real options data into a spreadsheet makes it easier to teach Black-Scholes, Greeks, and strategy P/L with actual market prices.
GOOGLEFINANCE vs MarketXLS for Options in Google Sheets
| Options Feature | GOOGLEFINANCE | MarketXLS |
|---|---|---|
| Option chains | Not available | =QM_GetOptionChain() |
| ATM options | Not available | =QM_GetOptionChainAtTheMoney() |
| ITM options | Not available | =QM_GetOptionChainInTheMoney() |
| Bid/Ask | Not available | Included in chain data |
| Volume | Not available | Included in chain data |
| Open interest | Not available | Included in chain data |
| Implied volatility | Not available | Included in chain data |
| Delta | Not available | Included in chain data |
| Gamma | Not available | Included in chain data |
| Theta | Not available | Included in chain data |
| Vega | Not available | Included in chain data |
| Rho | Not available | Included in chain data |
| Put/call ratios | Not available | Available |
| Pricing models | Not available | Black-Scholes value and Greeks functions |
| Historical IV | Not available | Available |
GOOGLEFINANCE has no options functions; MarketXLS adds option chains, contract quotes, Greeks, and options statistics.
How to Get Started
- Install MarketXLS from the Google Workspace Marketplace
- Get your license from the MarketXLS pricing page
- Type
=QM_GetOptionChain("AAPL")in any cell - The chain fills the sheet (end-of-day data on Standard; real-time on Advanced and Business)
MarketXLS also works in Excel through the Windows desktop add-in and the Microsoft 365 add-in (Mac and Excel for the web). Function names can differ by platform; on the Microsoft 365 add-in they use the mxls. prefix, so check the formulas page.
Frequently Asked Questions
Can I get option chain data in Google Sheets?
Yes. Install MarketXLS from the Google Workspace Marketplace and use =QM_GetOptionChain("AAPL") to pull the full options chain with bid, ask, volume, open interest, implied volatility, and all Greeks directly into Google Sheets.
Does GOOGLEFINANCE support options?
No. GOOGLEFINANCE has no options fields, so you cannot get option chains, Greeks, or other options data with it.
What options data does MarketXLS provide in Google Sheets?
MarketXLS provides full options chains with bid, ask, last price, volume, open interest, implied volatility, delta, gamma, theta, vega, and rho. It also provides put/call ratios, historical implied volatility, and Black-Scholes pricing functions. Options data is end-of-day on the Standard plan and real-time on the Advanced and Business plans.
Can I use MarketXLS for options strategy analysis?
Yes. You can pull live options chain data, track individual contract prices using =QM_Last(), calculate P/L for multi-leg strategies, and monitor Greeks exposure. Google Sheets lets you build custom strategy trackers with live data.
Does MarketXLS support SPX and index options?
Yes. You can use =QM_GetOptionChain("^SPX") for S&P 500 index options and other index options in Google Sheets.
Summary
The MarketXLS Google Sheets add-on returns option chains with =QM_GetOptionChain("AAPL"), including bid/ask, open interest, implied volatility, and Greeks, which GOOGLEFINANCE does not offer. Options data is end-of-day on the Standard plan and real-time on Advanced and Business; Google Sheets uses the same pricing as regular MarketXLS.
Get MarketXLS for Google Sheets | View Pricing | Options Profit Calculator | Option Scanner
