

Options Profit Calculator Excel
The most comprehensive options profit calculator for Excel. Build any strategy with up to 10 legs, visualize payoffs with Black-Scholes pricing, run Monte Carlo simulations, and analyze Greeks — all inside your spreadsheet. Includes 20+ preset strategies from covered calls to iron condors.
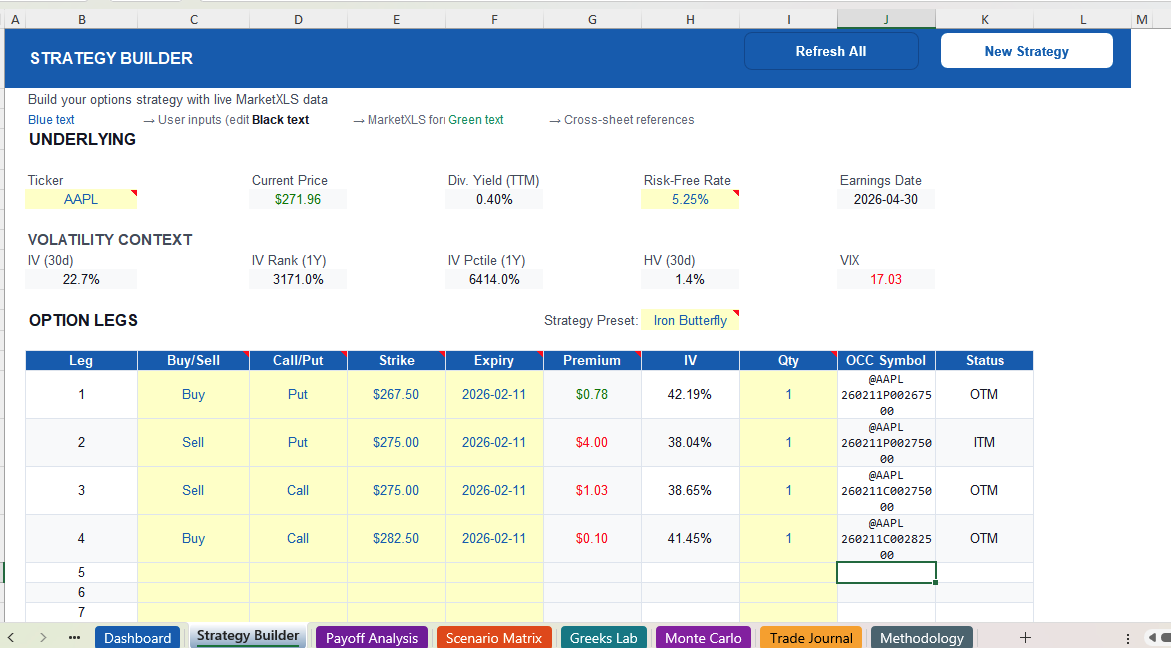
Strategy Builder — Any Strategy, Any Complexity
Build any options strategy with up to 10 option legs plus a stock position. The Strategy Builder pulls real-time data including IV rank, IV percentile, and historical volatility so you can make informed decisions before entering a trade.
Choose from 20+ preset strategies — covered calls, iron condors, butterflies, straddles, calendar spreads, and more — or create entirely custom multi-leg positions. Each leg shows its OCC symbol and validation status automatically.
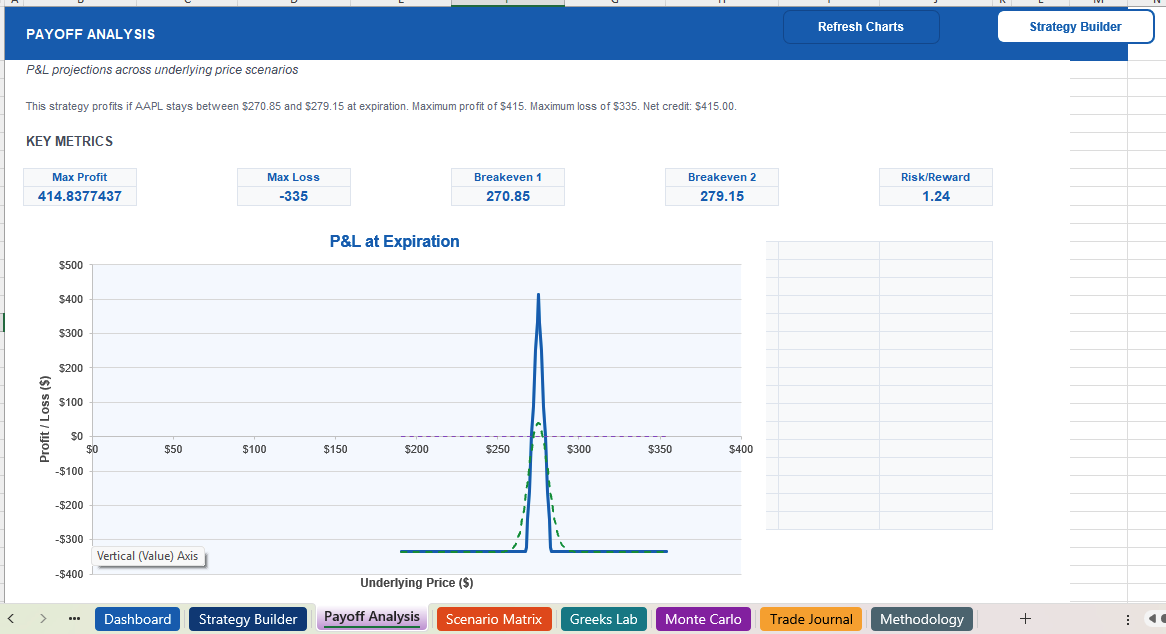
Payoff Charts with Time Decay
See exactly how your options strategy performs across 200 price points with the built-in Black-Scholes pricing engine. The payoff chart shows P&L at expiry plus time-decay curves at T-30, T-14, T-7, and today — so you can visualize how theta erodes your position day by day.
Instantly see breakeven points, maximum profit, maximum loss, net debit/credit, and probability of profit. The calculator also includes a target price solver that tells you what the underlying needs to reach for your desired P&L.
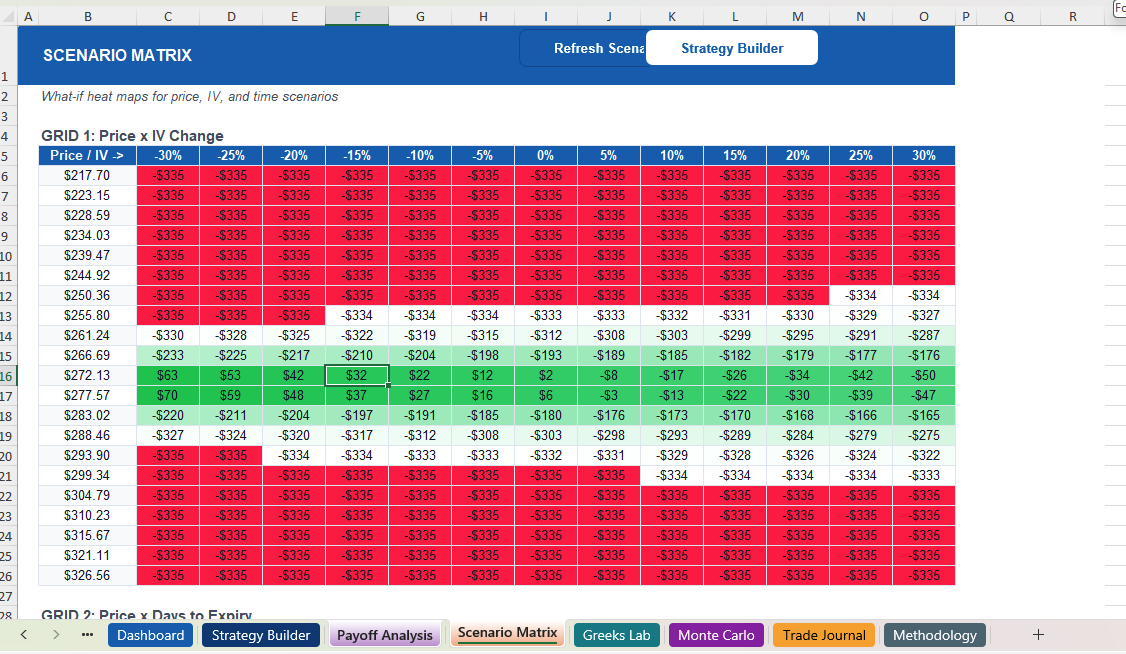
Scenario Matrix — Three Heat Map Grids
Stress-test your options strategy under different market conditions with three scenario matrix heat maps:
- Price × IV — See P&L across 21 price levels and 13 volatility shifts (-30% to +30%)
- Price × DTE — Understand how time decay affects your position at different prices
- IV × DTE — Analyze the interplay between implied volatility changes and time remaining
Each cell is color-coded from green (profit) to red (loss), giving you an instant visual read on your risk/reward profile.
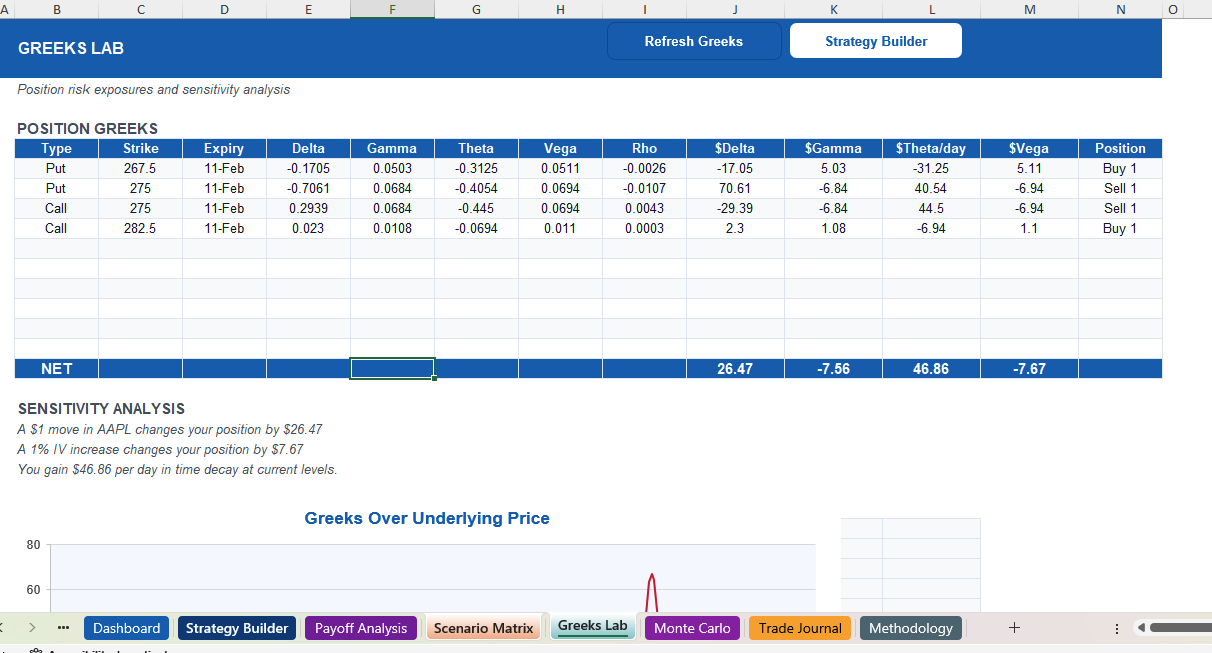
Greeks Lab — Delta, Gamma, Theta, Vega, Rho
The Greeks Lab calculates all five option Greeks for every leg individually and as net portfolio values. Each Greek is computed using the Black-Scholes model with automatic implied volatility calculation via Newton-Raphson iteration.
Below the Greeks table, you get a plain-English interpretation explaining what your Greeks exposure means — for example, whether your position benefits from rising volatility or is vulnerable to time decay.
Monte Carlo Simulation
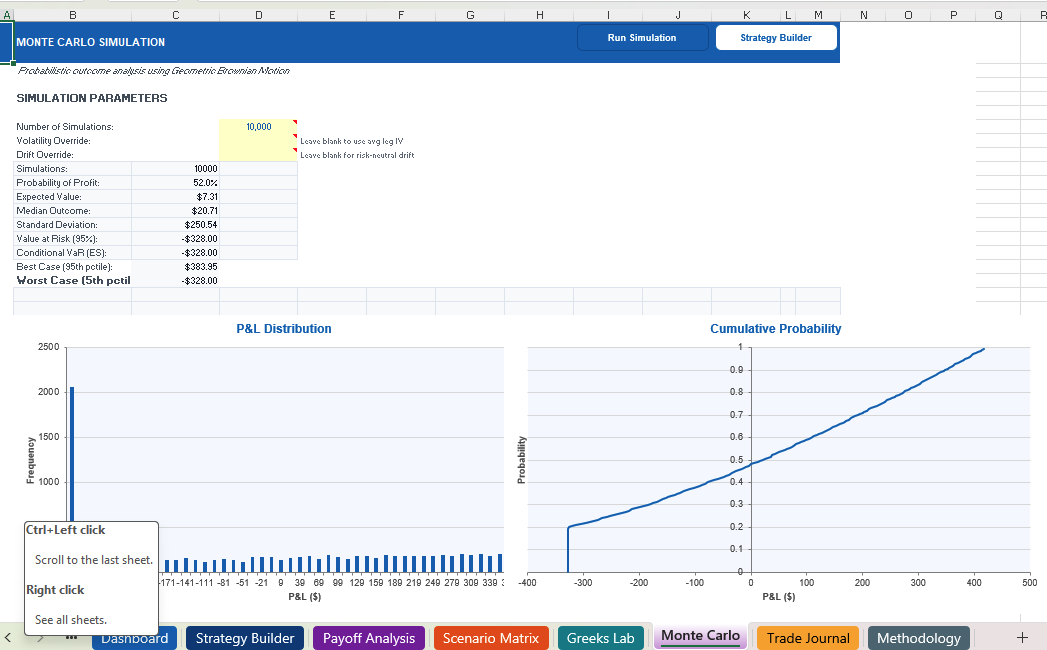
Run up to 100,000 Geometric Brownian Motion price paths to estimate your strategy's probability distribution. The Monte Carlo engine uses historical volatility and the risk-free rate to simulate realistic price trajectories through expiration.
Get key risk metrics including expected P&L, probability of profit, Value at Risk (VaR) at the 95th percentile, Conditional VaR (CVaR), and percentile breakdowns (10th, 25th, 50th, 75th, 90th). Essential for understanding the realistic distribution of outcomes beyond simple max-profit/max-loss.
Trade Journal — Log, Track, and Improve
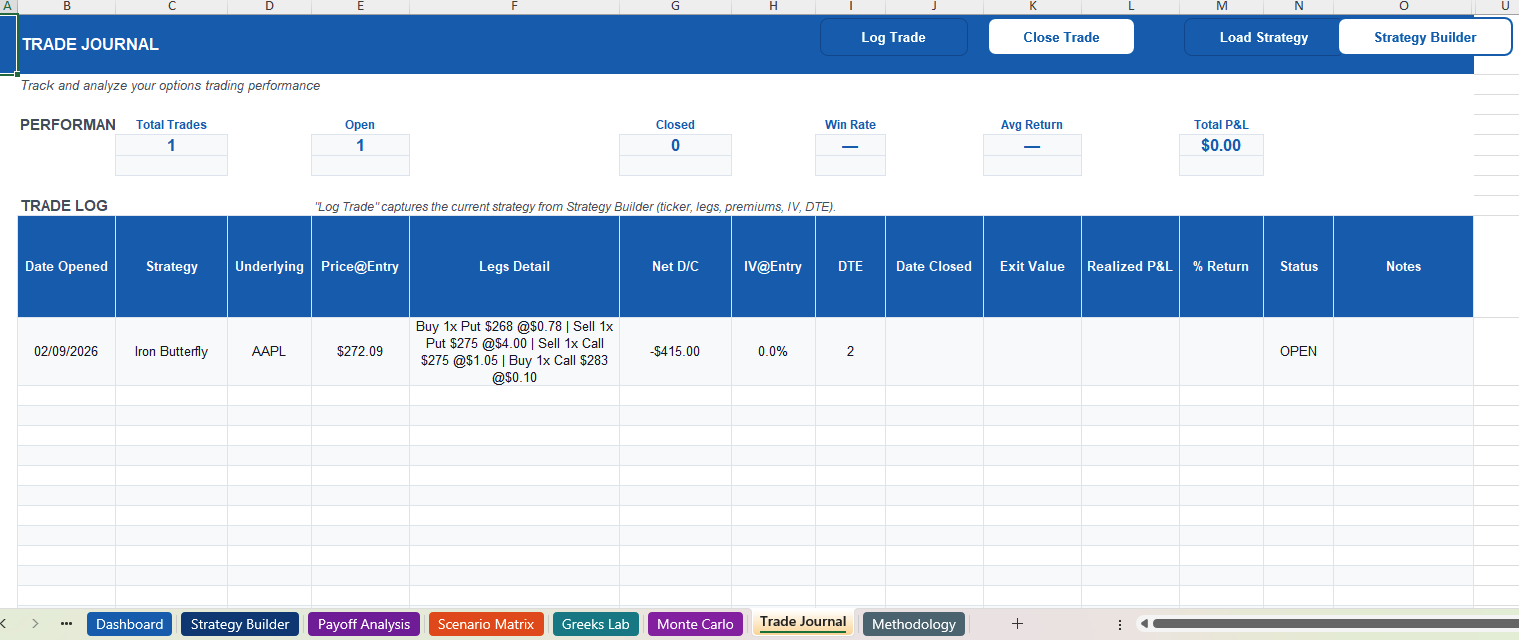
Keep a record of every options trade directly in your spreadsheet. The Trade Journal logs your strategy details, entry notes, and timestamps. When you close a trade, it captures P&L, close date, and exit notes.
Built-in analytics track your win rate, average P&L, total realized gains, and best/worst trades. You can also reload any past trade back into the Strategy Builder to review or adjust it.
Everything You Need in One Excel Template
Real-Time Dashboard
Key metrics at a glance — current P&L, Greeks summary, max profit/loss, breakeven points, and AI-generated strategy insights updated with every refresh.
20+ Preset Strategies
Covered call, protective put, bull/bear spreads, iron condor, butterfly, straddle, strangle, collar, calendar spread, ratio spreads, and more — loaded with one click.
Black-Scholes Engine
Professional-grade VBA implementation with CDF approximation accurate to 7+ decimal places. Computes theoretical prices and implied volatility via Newton-Raphson solver.
Keyboard Shortcuts
Ctrl+Shift+R to refresh all calculations, Ctrl+Shift+C to clear the strategy, Ctrl+Shift+L to log trades, and more — designed for efficient workflow.
Light & Dark Themes
Switch between professionally styled light and dark themes. Both themes apply across all sheets with coordinated colors for charts, headers, and data.
MarketXLS Integration
Connects to MarketXLS for live stock prices, dividend yields, earnings dates, and real-time option chains — keeping your analysis current.
How the Options Profit Calculator Works
The template uses VBA macros that call MarketXLS functions to pull live market data. Enter a ticker symbol and the template automatically fetches the current stock price, dividend yield, implied volatility metrics, and real-time option chain data.
Select a preset strategy or manually configure each leg with strike price, expiry, and quantity. Press Ctrl+Shift+R and the Calc Engine computes payoff arrays across 200 price steps using Black-Scholes pricing. The results instantly populate the Payoff Analysis chart, Scenario Matrix heat maps, and Greeks Lab.
To get started, you need an active MarketXLS subscription with options data access. The template works with Excel for Windows and requires macros to be enabled.
Want to explore more options tools? Check out our web-based Options Profit Calculator for quick online analysis, or browse our full library of Excel templates for options and stock analysis.
Frequently asked questions
With the MarketXLS Options Profit Calculator Excel template, you enter a stock ticker, build your option legs (up to 10), and the template automatically calculates your P&L at expiration and at every point until expiry using the Black-Scholes pricing model. It generates payoff charts, breakeven prices, max profit, max loss, and probability of profit — all inside Excel with real-time data from MarketXLS.
The template supports any multi-leg option strategy including covered calls, cash-secured puts, vertical spreads (bull call, bear put), iron condors, iron butterflies, straddles, strangles, calendar spreads, diagonal spreads, and fully custom strategies. You can combine up to 10 option legs plus a stock position. It includes 20+ preset strategies that auto-populate with live strikes and premiums.
The Scenario Matrix generates three heat-map grids showing how your strategy performs under different conditions: Price vs. IV Change, Price vs. Days to Expiry, and IV Change vs. DTE. Each cell is color-coded red (loss) to green (profit) so you can instantly see where your strategy makes or loses money across hundreds of scenarios.
The Monte Carlo engine runs up to 100,000 simulations of your stock price using Geometric Brownian Motion with daily steps. It outputs probability of profit, expected value, median outcome, Value at Risk (VaR at 95%), Conditional VaR (Expected Shortfall), and generates both a P&L histogram and cumulative probability chart — giving you a statistical edge in evaluating your trades.
The template works best with an active MarketXLS subscription, which provides real-time streaming option prices, live option chains, implied volatility data, and Greeks directly in Excel. However, you can also use the template manually by entering your own strike prices, premiums, and expiry dates — the Black-Scholes engine and all analytics run locally in VBA with no external calls needed.
The Greeks Lab sheet calculates Delta, Gamma, Theta, Vega, and Rho for each individual leg and for the net position. It shows both per-share values and dollar-weighted (position-adjusted) values, so you know exactly how a $1 price move, 1% IV change, or one day of time decay affects your entire position. It also charts all Greeks across a range of underlying prices.

Book a demo with our team to explore the features and workflows relevant to your research.