


To get your Yahoo Finance portfolio into Excel, open the portfolio on Yahoo Finance, use its export option to download a CSV file, and open it in Excel. To analyze it, put the symbols and their portfolio weights (summing to 100%) in a two-column range and point MarketXLS portfolio functions at it, for example =monthlyReturns(B3:C11, 18) for 18 months of monthly returns. This 2020 walkthrough shows each step with screenshots; Yahoo's menus may have changed since.
And with the “Create New View” screen you can simply add many more parameters in the table and compare the detailed performance of each stock in your portfolio.
Yahoo finance portfolios provide a very convenient way to export your portfolio in Excel.
With one click now, you have your portfolio in Excel. The downloaded file contains your exported portfolio holdings.
At MarketXLS, we have created a utility and template which takes and this input and turns yahoo portfolio into a portfolio analytics dashboard in your Excel using MarketXLS’s portfolio analytics functions.
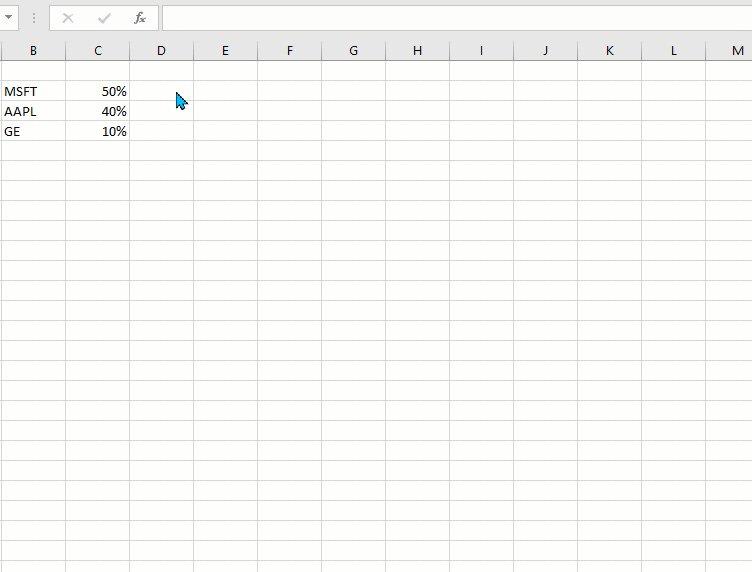
A portfolio is essentially a range of cells that has the stocks in your portfolio and the corresponding proportion of stocks.
The total of all the weights in the portfolio should need to be 100% for these functions to work. These portfolio functions should work for all US & Canadian stocks and ETFs.
In this example, the range B3:C11 is the portfolio input.
We have a category for portfolio functions. You should see this in Excel’s functions browser.
In all MarketXLS portfolio functions, a portfolio range is the first and the only required input. The default time period we use for all our calculations is 12 months and all the results are calculated with monthly returns. The number of periods can be modified by providing an optional integer value after the portfolio as shown below.
=monthlyReturns(“Portfolio Range”,18) will return monthly returns for 18 months.
We would recommend downloading the presentation for these functions and further details around calculations and inputs to these functions.
efficient frontier calculator
Download the presentation here.
