Portfolio manager
Multi-faceted Portfolio Analysis At Your Fingertips
Risk-Return Analysis
Use a comprehensive list of risk and return analysis functions in your Excel.
Portfolio Optimizations
Calculate efficient frontier, Montecarlo simulation and get the best returns on your portfolio at lowest risk
The Feature Highlights
Things That MarketXLS Does For You In The Background With Just A Set Of Assets And Weights
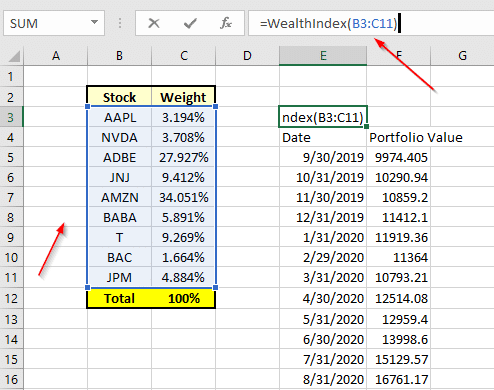
No downloading of data, quick and easy portfolio analytics with easy to use functions
No downloading of data, quick and easy portfolio analytics with easy to use functions Define your portfolio as a range of Excel that has your stocks and the proportion of stocks in the portfolio. The total should be 100%. Once you have this portfolio inputs you are ready to use various portfolio analytics functions.
Basic Analysis Metrics
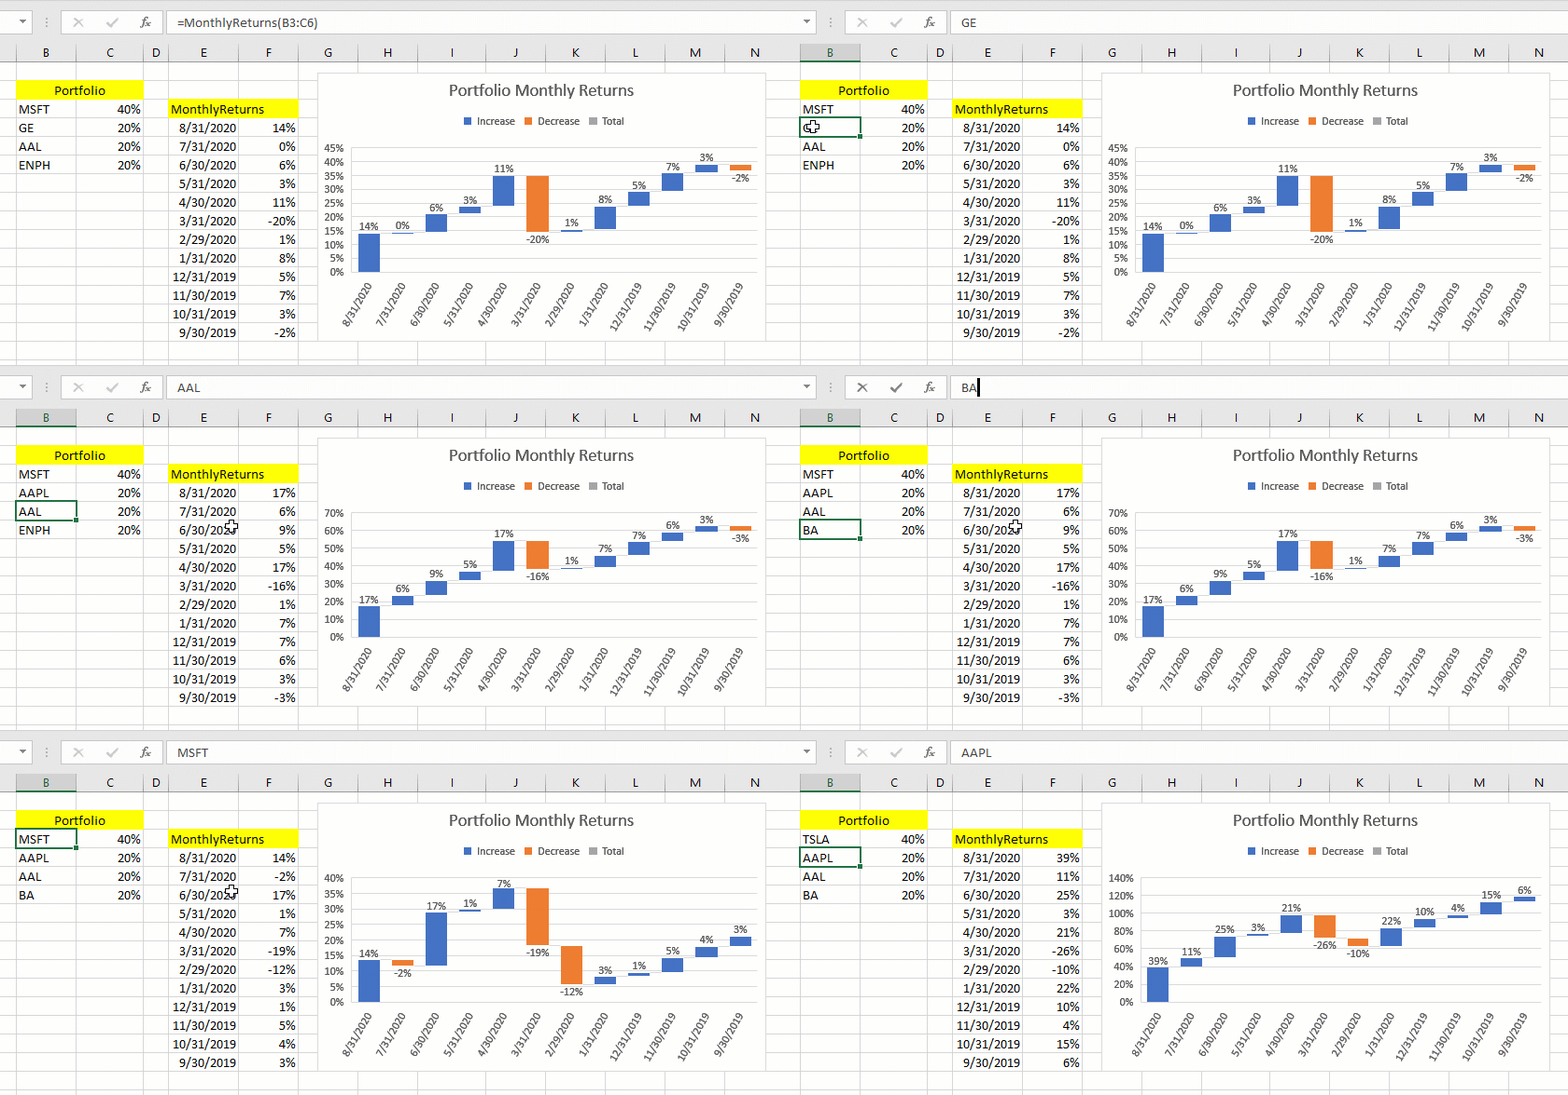
Portfolio Monthly Returns
Calculate historical monthly returns for dynamically adjustable periods through the most accurate price data.
=MonthlyReturns(Portfolio, Periods)
Portfolio Efficient Frontier
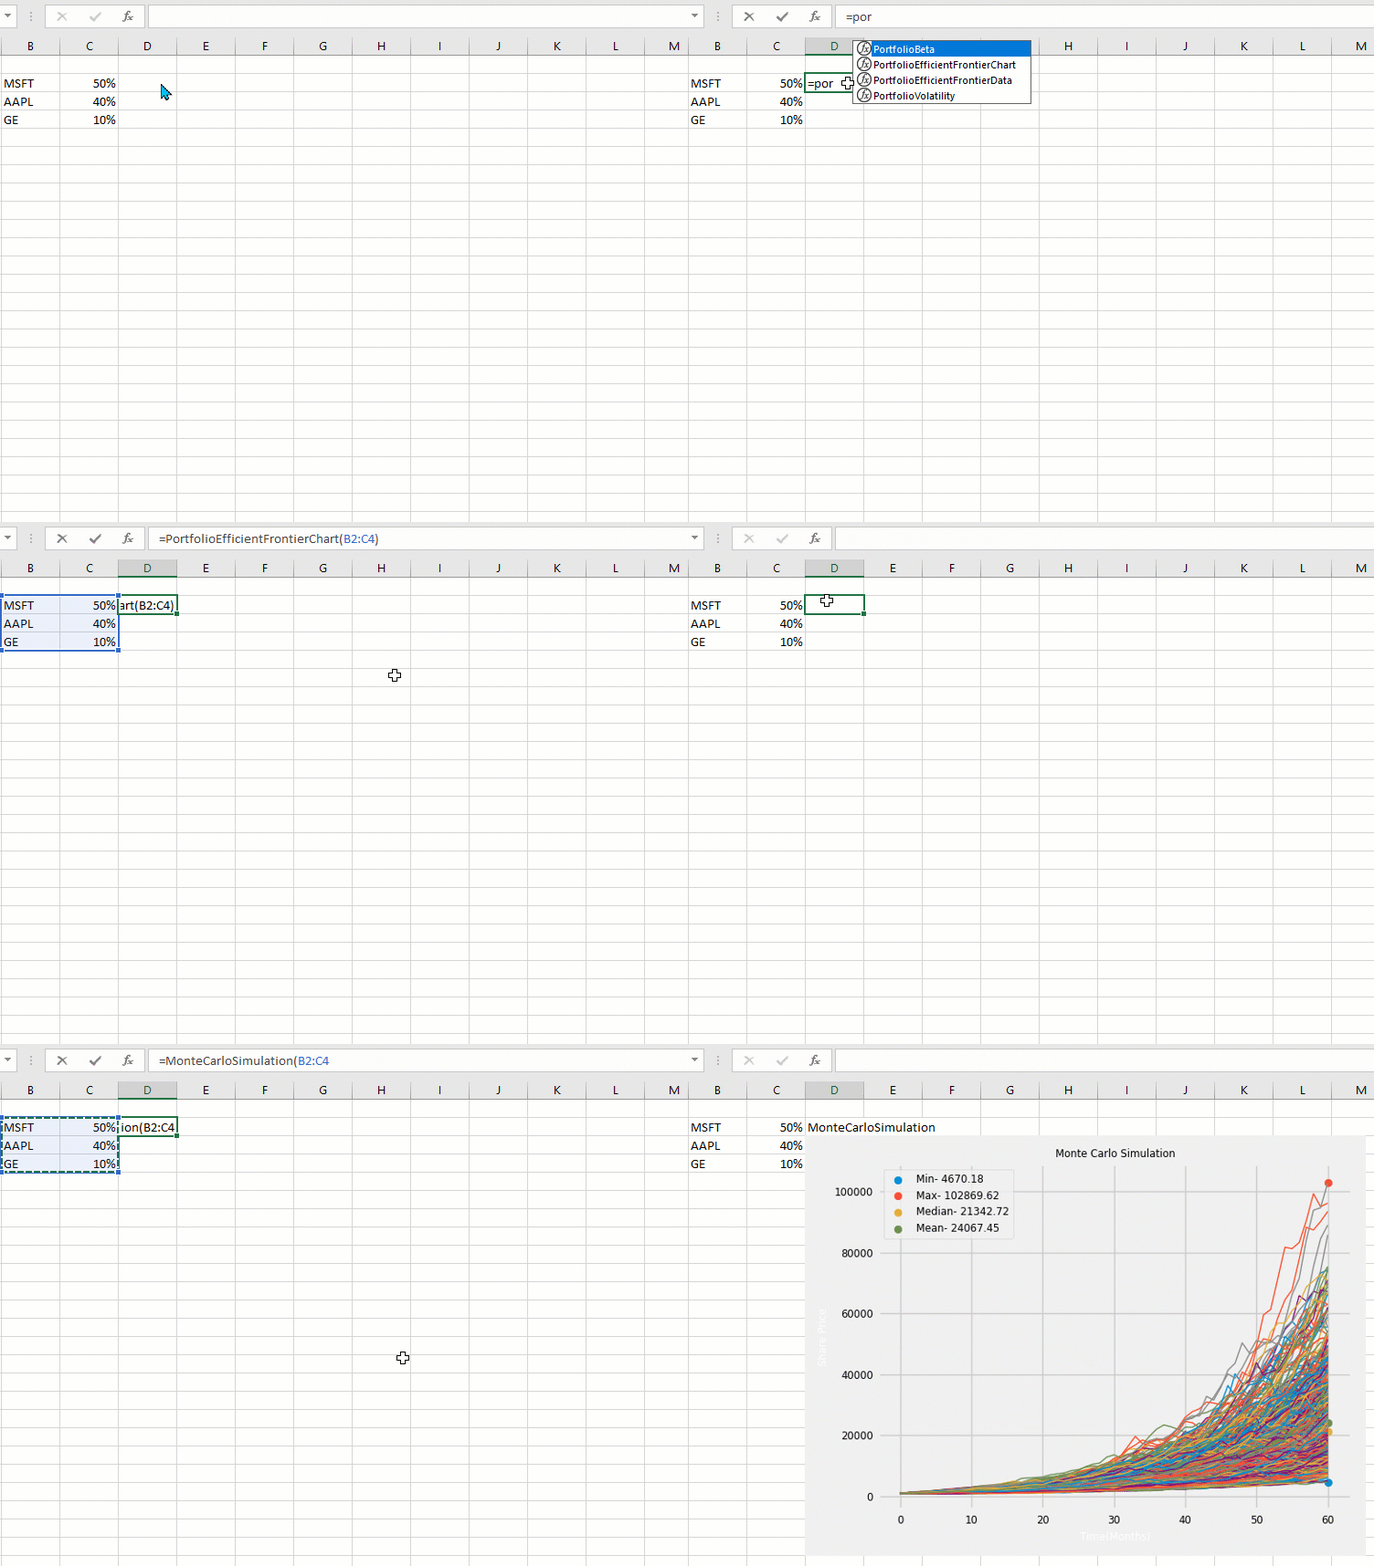
Get ready-made chart images for Efficient Frontier, Monte Carlo Simulation and many more.
=PortfolioEffecientFrontierChart(Portfolio, Periods)
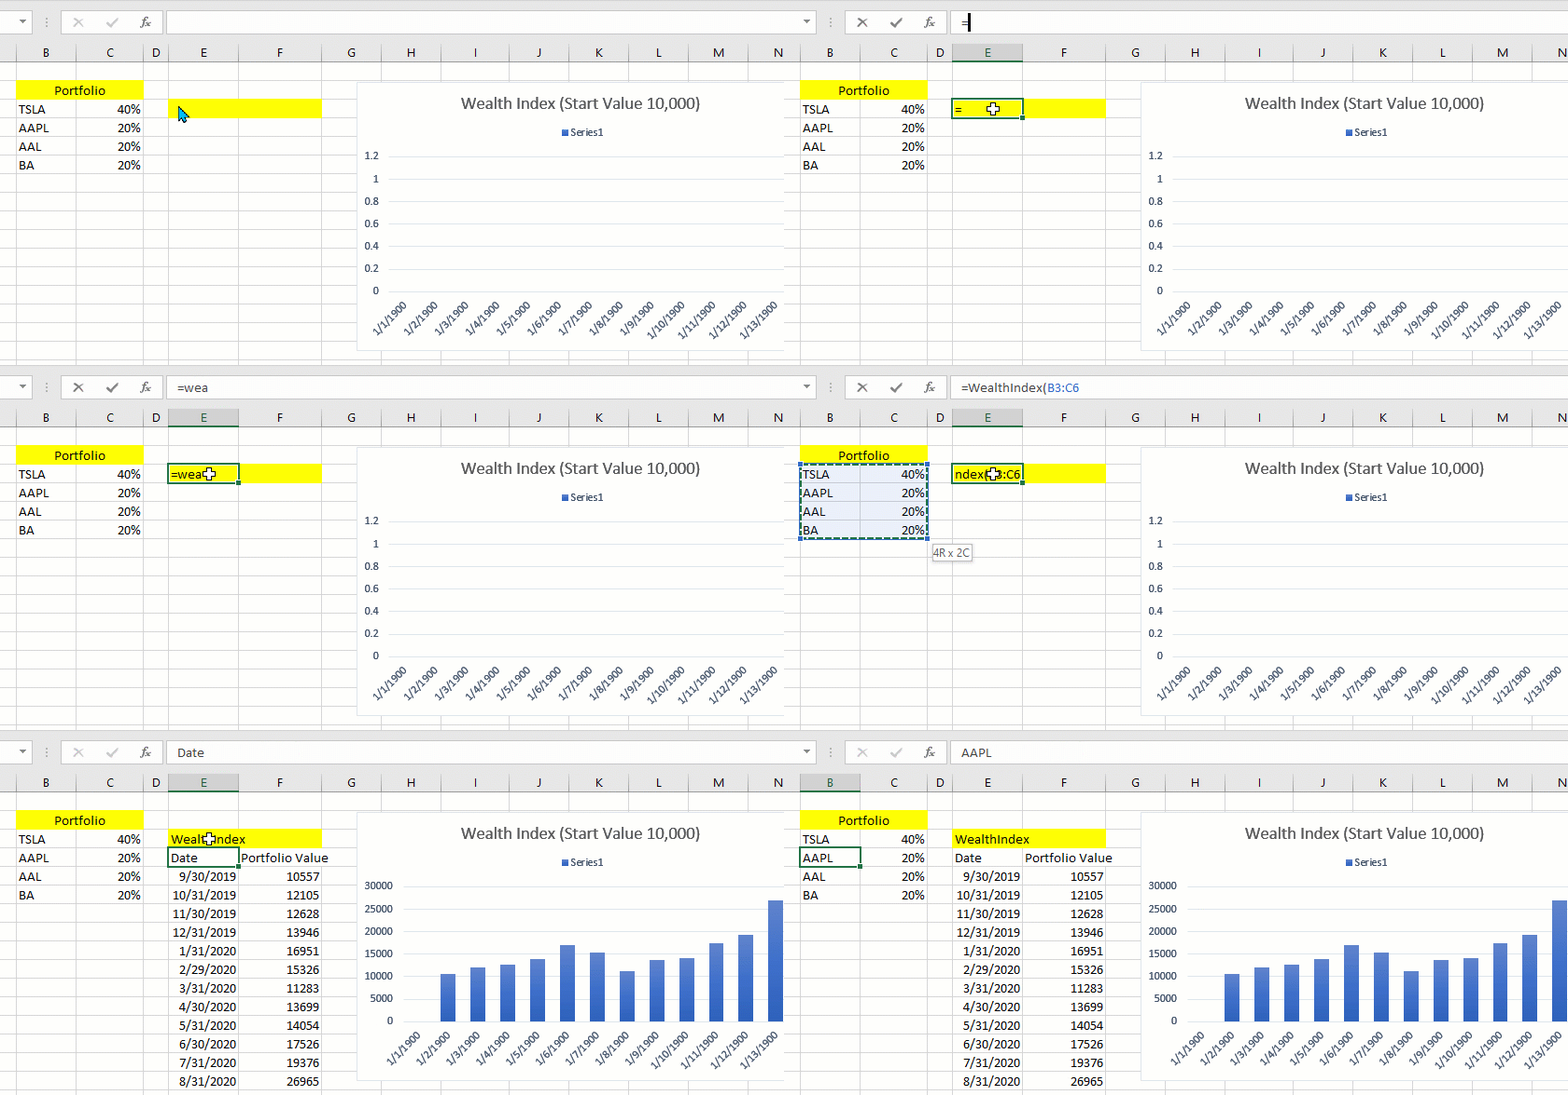
Calculate historical wealth index assuming you started with a USD 10K account
=WealthIndex(Portfolio, Periods)
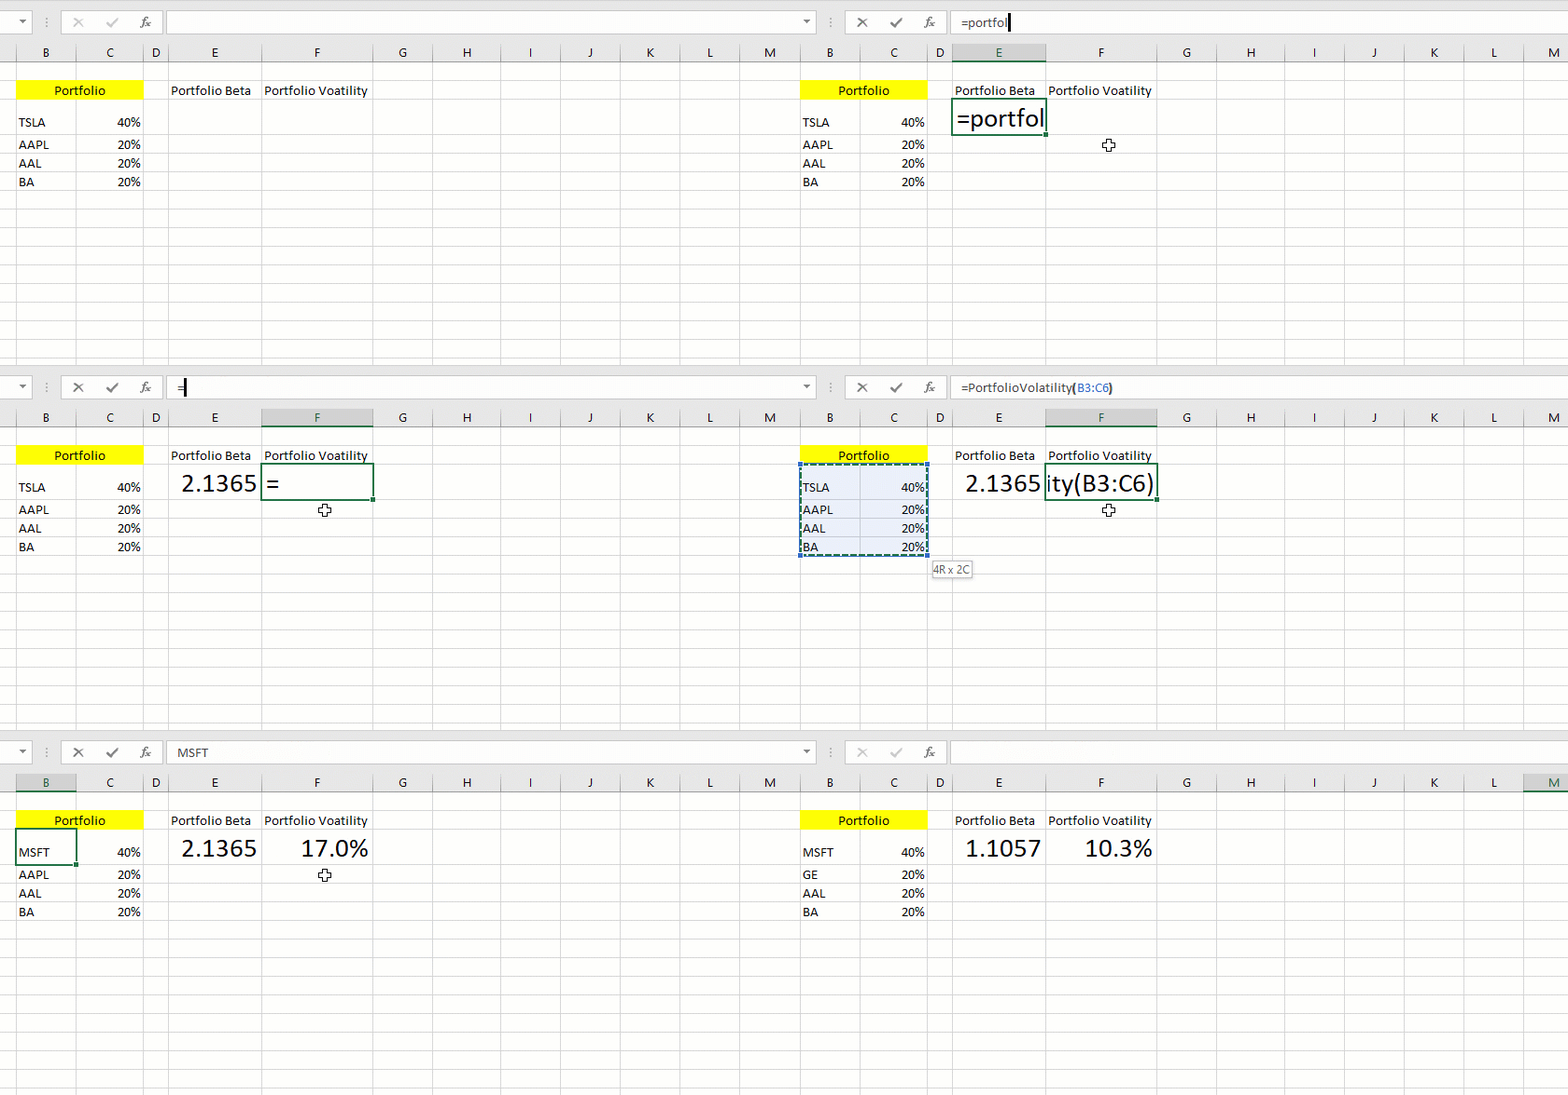
Portfolio Beta & Portfolio Volatility
Calculate your Portfolio‘s Beta and Volatility with the functions as shown below. The default index used for calculations is SPY
=PortfolioBeta(Portfolio)
,=PortfolioVolatility(Portfolio)
Call: 1-877-778-8358 

Welcome! I'm Ankur, the founder and CEO of MarketXLS. With more than ten years of experience, I have assisted over 2,500 customers in developing personalized investment research strategies and monitoring systems using Excel.
I invite you to book a demo with me or my team to save time, enhance your investment research, and streamline your workflows.
I invite you to book a demo with me or my team to save time, enhance your investment research, and streamline your workflows.
Implement "your own" investment strategies in Excel with thousands of MarketXLS functions and templates.
MarketXLS provides all the tools I need for in-depth stock analysis. It's user-friendly and constantly improving. A must-have for serious investors.
I have been using MarketXLS for the last 6+ years and they really enhanced the product every year and now in the journey of bringing in AI...
MarketXLS is a powerful tool for financial modeling. It integrates seamlessly with Excel and provides real-time data.
I have used lots of stock and option information services. This is the only one which gives me what I need inside Excel.