Mon Jun 02 2025 • By admin
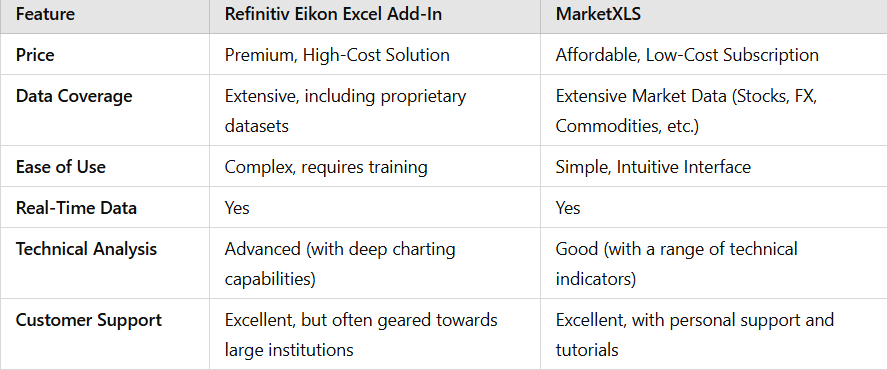
FactSet vs MarketXLS: Streamlining Financial Analysis in Excel
Introduction In today’s fast-paced financial markets, accessing reliable and timely data is crucial for making informed investment decisions. Financial professionals often rely on sophisticated tools like FactSet to gather comprehensive data and perform advanced analytics. However, these platforms can be complex, expensive, and may not integrate seamlessly with familiar tools like Microsoft Excel. Enter MarketXLS—a […]