

Fund overlap is reported as a single percentage, but that number is calculated three different ways and hides which of the two funds is the subset. Here is how to read it properly.
ETFs, Funds & Alternatives
Expert insights on stock market analysis, investment strategies, and Excel techniques for smarter investing.

Mutual fund comparison usually starts with a return column, and that column answers two different questions at once. Here is how to separate the cost of a share class from the behavior of a portfolio, with figures computed on August 18, 2026.
Fund overlap is reported as a single percentage, but that number is calculated three different ways and hides which of the two funds is the subset. Here is how to read it properly.

Mutual fund Google Sheets workflows are popular for a reason, but they hit hard ceilings around NAV coverage, yield, risk metrics, and history. This guide shows what Google Sheets does well for mutual fund tracking, where it falls short, and what MarketXLS adds.

Mutual fund comparison tool guide showing how to compare holdings, expense ratios, performance, overlap, and risk metrics across mutual funds and ETFs side by side for better investment decisions.
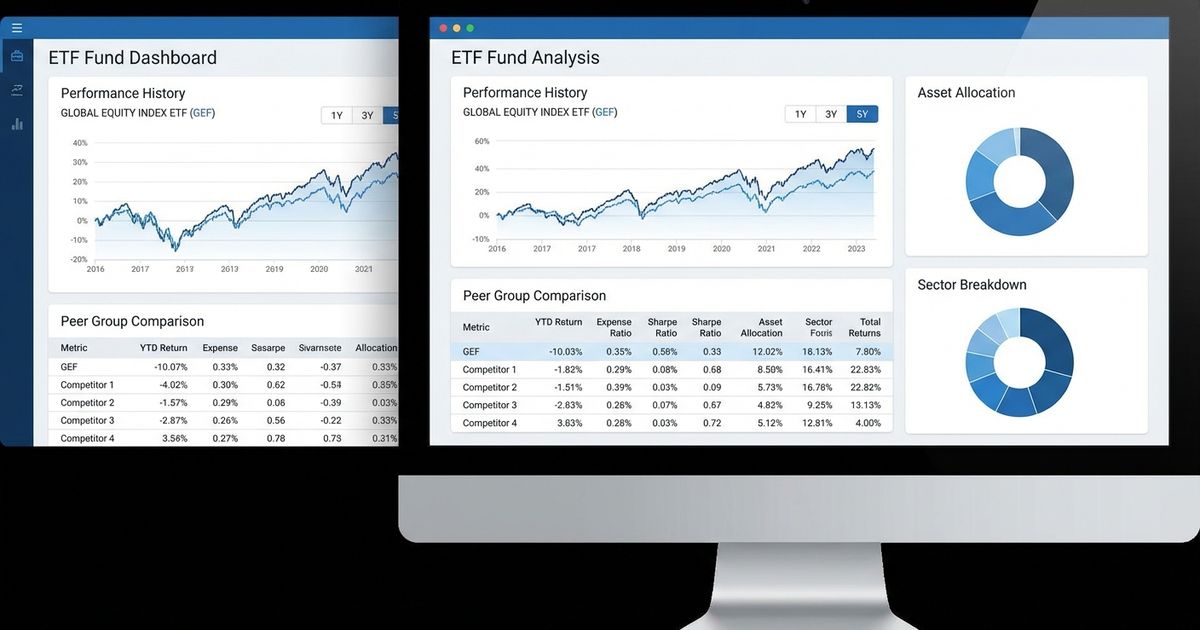
ETF portfolio construction requires more than picking popular funds — you need proper asset allocation, overlap analysis, risk assessment, and periodic optimization to build a portfolio that actually performs as intended.

Best value ETF options ranked by proprietary value scores, historical performance, expense ratios, and holdings quality — covering large-cap, mid-cap, small-cap, and international value funds for every portfolio strategy.

Compare ETFs effectively by analyzing holdings overlap, expense ratios, performance history, sector exposure, and risk metrics side by side — not just top-level numbers that hide the real differences between funds.

ETF screener tools help investors filter thousands of exchange-traded funds by expense ratio, sector, holdings, performance, and risk metrics to find the best ETFs for their portfolio strategy.

Best performing ETFs over the last decade delivered 20%+ annual returns — led by semiconductor and tech funds. See the full list with returns, expense ratios, and how to analyze them in Excel.

Real Time Futures Prices in Excel with MarketXLS — stream live Nasdaq, Dow Jones, S&P 500, crude oil, gold and more using QM_Stream functions directly in your spreadsheets.

Hedge portfolio with ETFs using strategic asset allocation, inverse funds, gold, bonds, and buffer ETFs. This professional guide covers every hedging method with real MarketXLS formulas and risk dashboards.

Spot Bitcoin ETFs launched in 2024, unlocking institutional access to cryptocurrency. Learn which bitcoin ETF is best by tracking fund flows, fees, and liquidity using data-driven analysis in Excel.

Gold ETFs provide hedging against inflation and volatility. Learn how to invest in gold ETFs, compare physically-backed vs. mining funds, and find the best gold ETF using data-driven analysis.

ETF strategies for leveraged, inverse, and covered call funds require precise risk analysis. Learn the mechanics, risks, and MarketXLS formulas to analyze these advanced instruments like a professional.

ETF risk analysis guide covering alpha, beta, Sharpe ratio, Sortino ratio, max drawdown, standard deviation, and R-squared — with step-by-step Excel implementation using MarketXLS.

ETF portfolio diversification requires more than picking multiple funds. Learn how to identify hidden overlap, build truly diversified allocations, and optimize your ETF portfolio using MarketXLS and FundXLS tools.
Discover how 2,500+ serious investors are saving 15+ hours every week with real-time market data directly in Excel.
✓ No credit card required • ✓ 14-day money-back guarantee • ✓ Cancel anytime