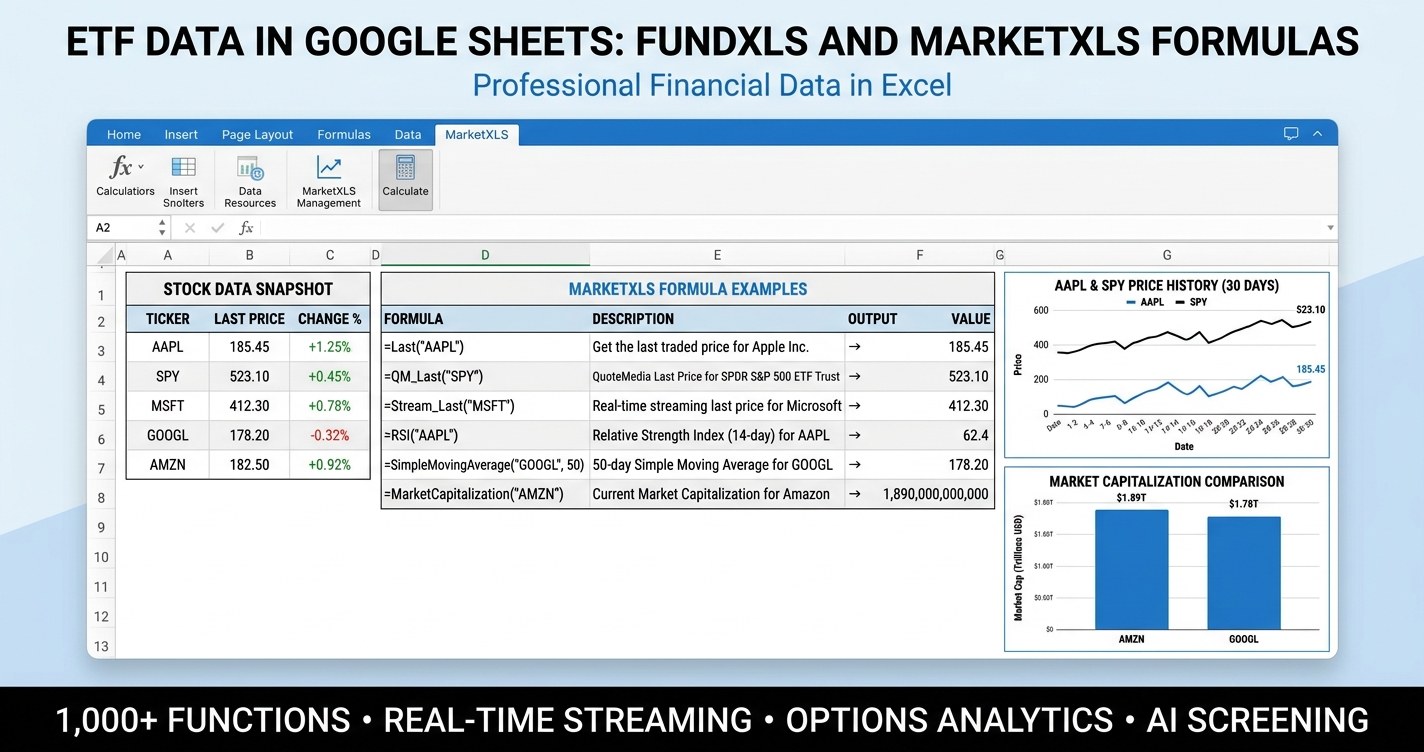
ETF data in Google Sheets is workable for prices, but AUM, expense ratio, top holdings, inception date, and option chains live outside GOOGLEFINANCE. This guide shows how FundXLS and the MarketXLS Google Sheets add-on close every gap, with verified formulas, a sample workbook, and a live template.
MarketXLS Blog
Expert insights on stock market analysis, investment strategies, and Excel techniques for smarter investing.
Featured Series
ETF data in Excel, pulled live with MarketXLS formulas for price, AUM, expense ratio, yield, returns, and a composite Cost-Quality Score across 25 well-known funds as of late May 2026.
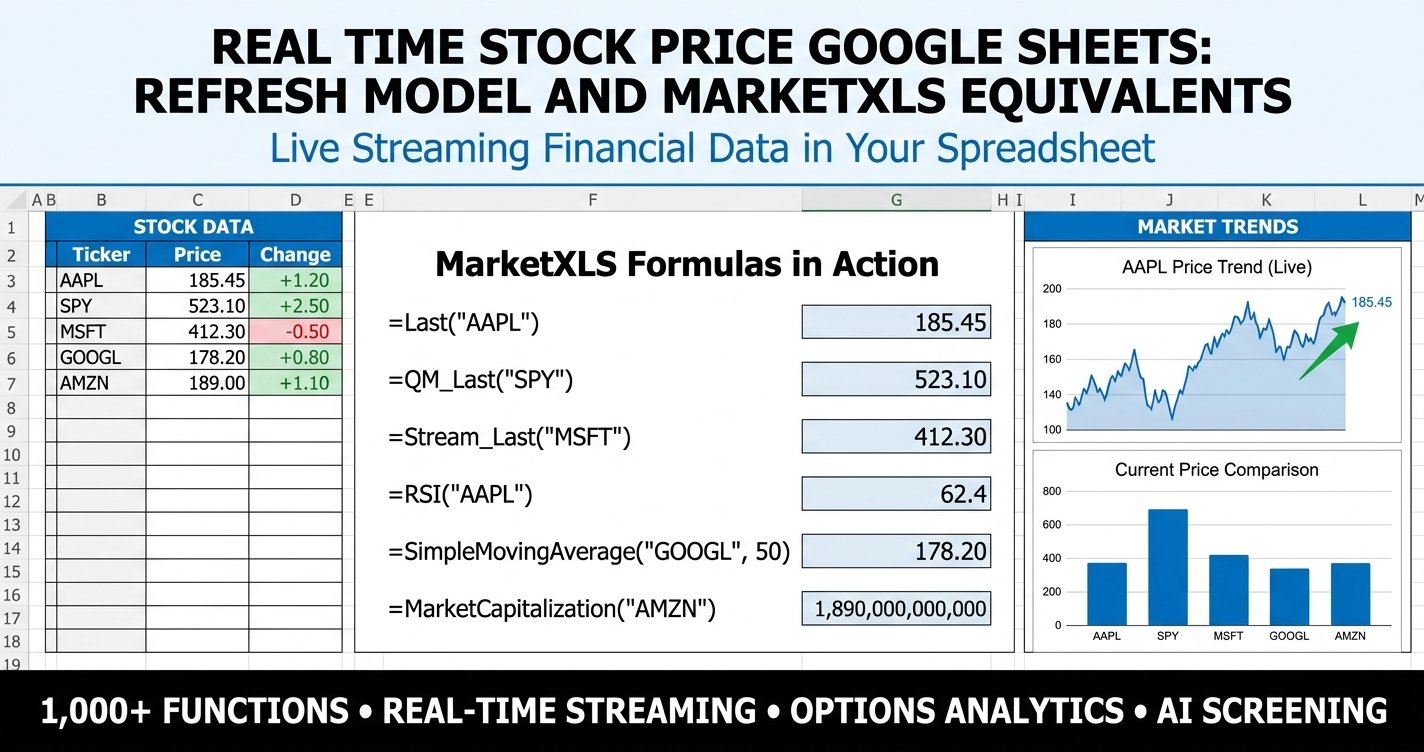
Real Time Stock Price Google Sheets is the most-asked spreadsheet question of the year, but the actual refresh model of GOOGLEFINANCE is far slower than the words suggest. This guide explains exactly how live each attribute is, where the delays hurt, and how MarketXLS streaming formulas fill the gap with a free downloadable template.
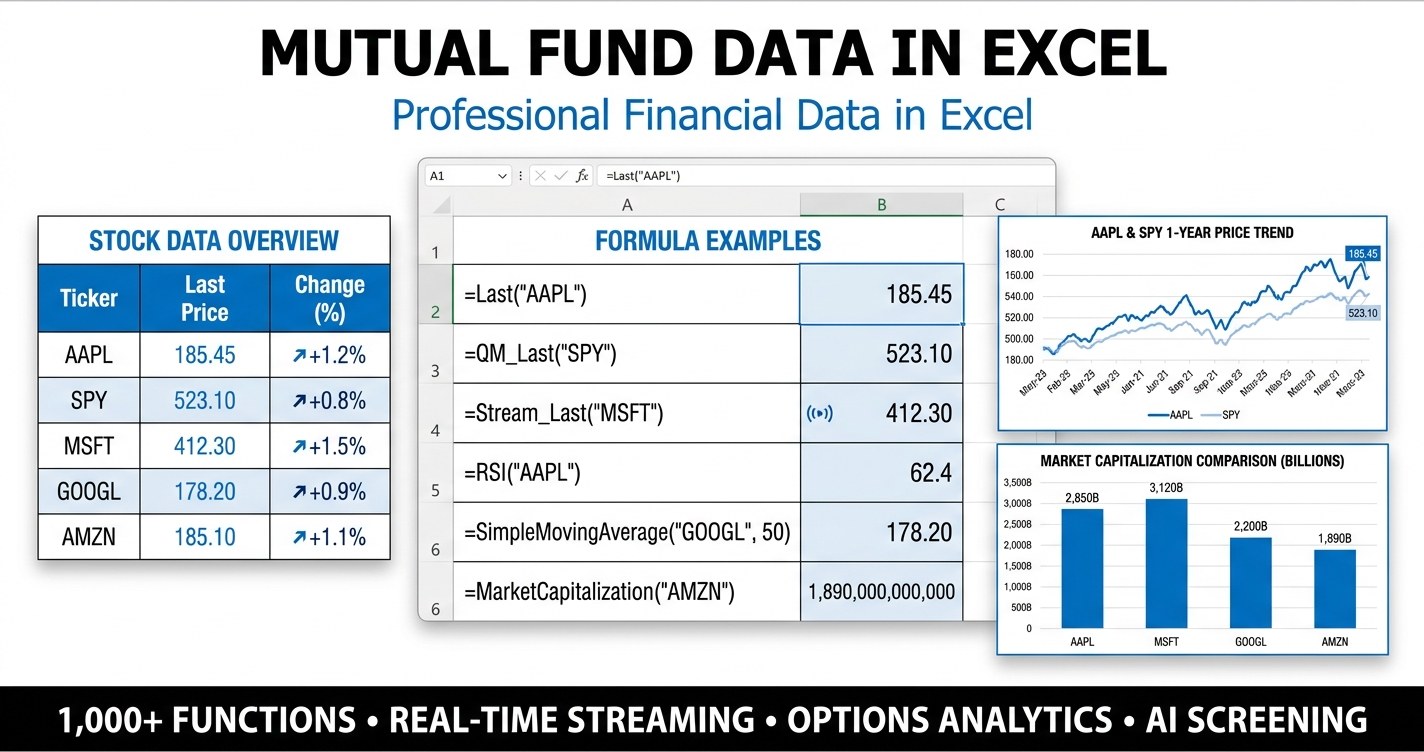
Mutual fund data in Excel, pulled live with MarketXLS formulas for NAV, fund assets, expense ratio, yield, YTD and 3-year return, volatility, and top holdings across 25 popular index, active, balanced, and target date funds.
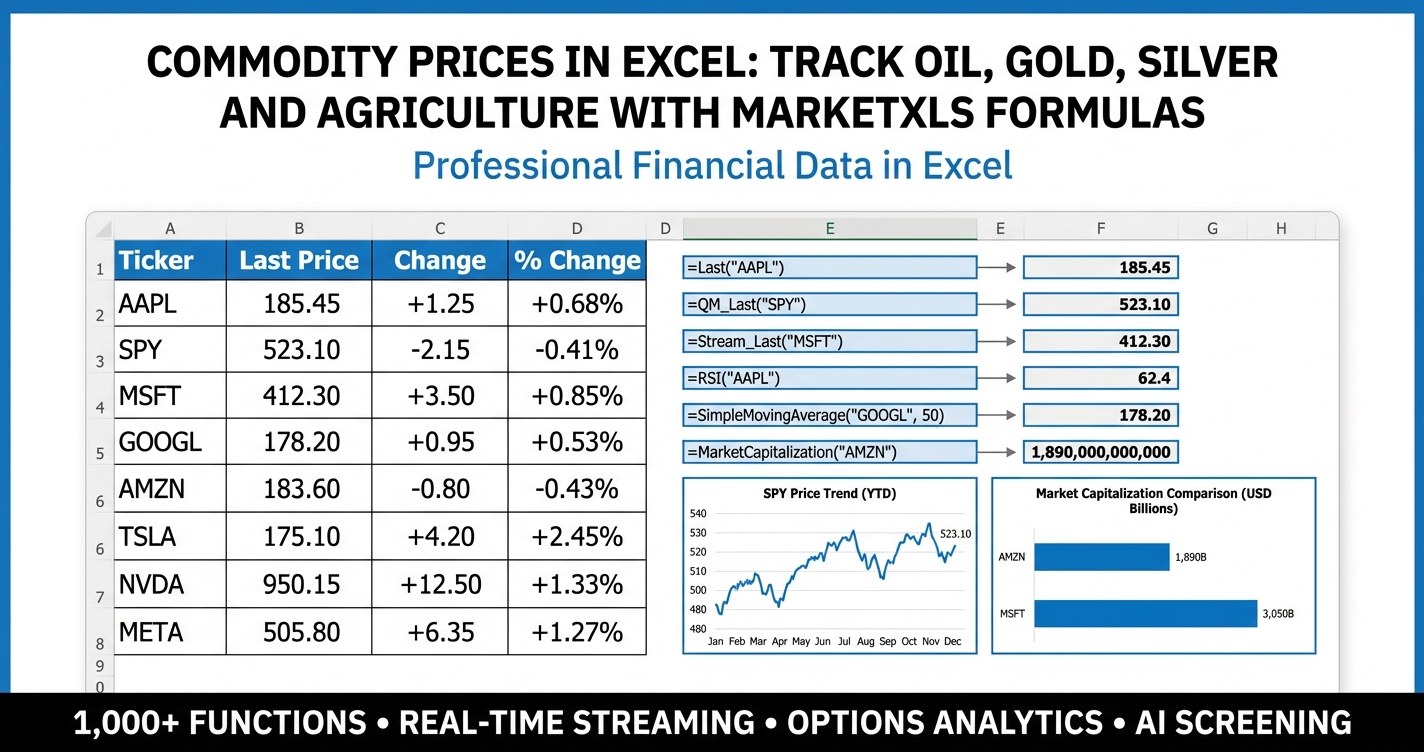
Commodity prices in Excel - track oil, gold, silver, natural gas, copper and agriculture in one live workbook using MarketXLS formulas across 16 commodity ETFs and 15 commodity-linked stocks.
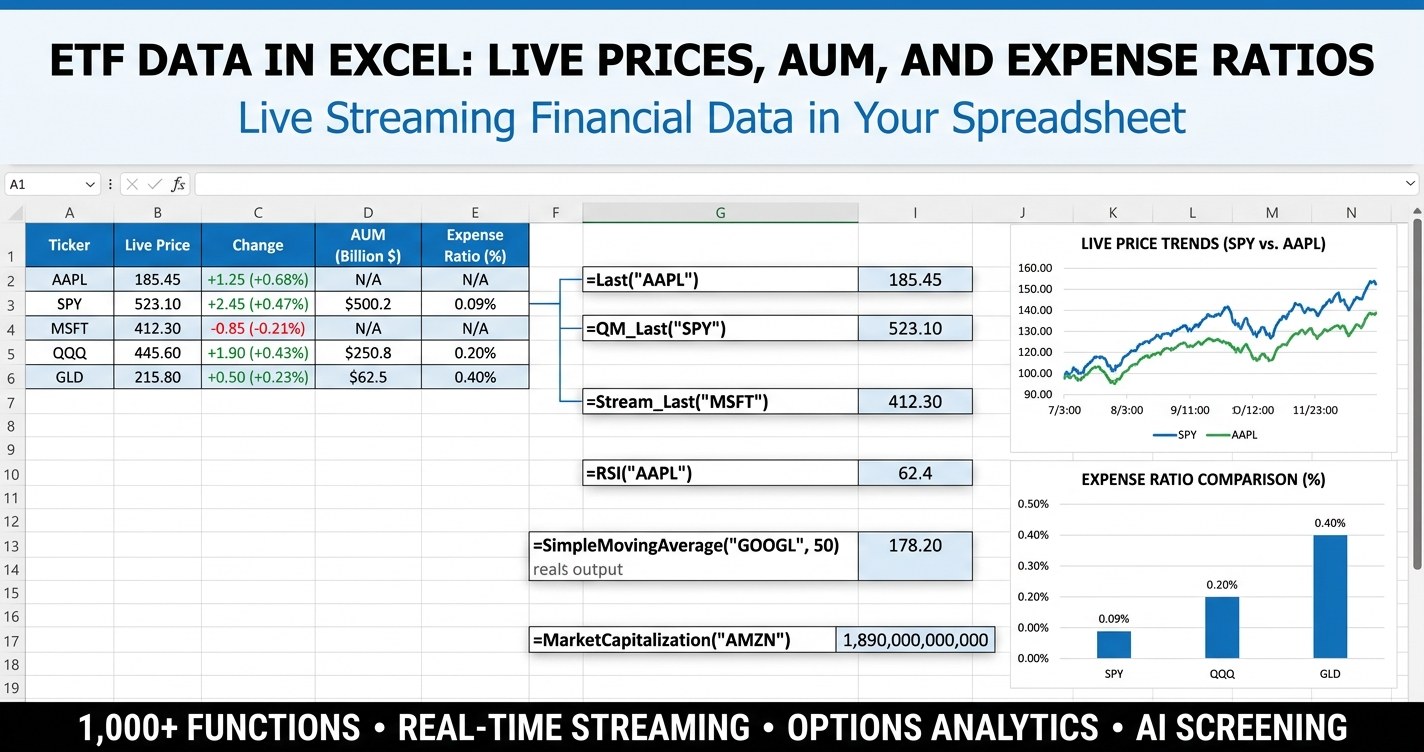
ETF data in Excel, pulled live with MarketXLS formulas for price, AUM, expense ratio, yield, YTD return, volatility, and top holdings across 25 well-known funds.
ETF holdings in Excel - pull live top constituents of any ETF straight into a spreadsheet, then score overlap, concentration, and sector exposure with one formula each.
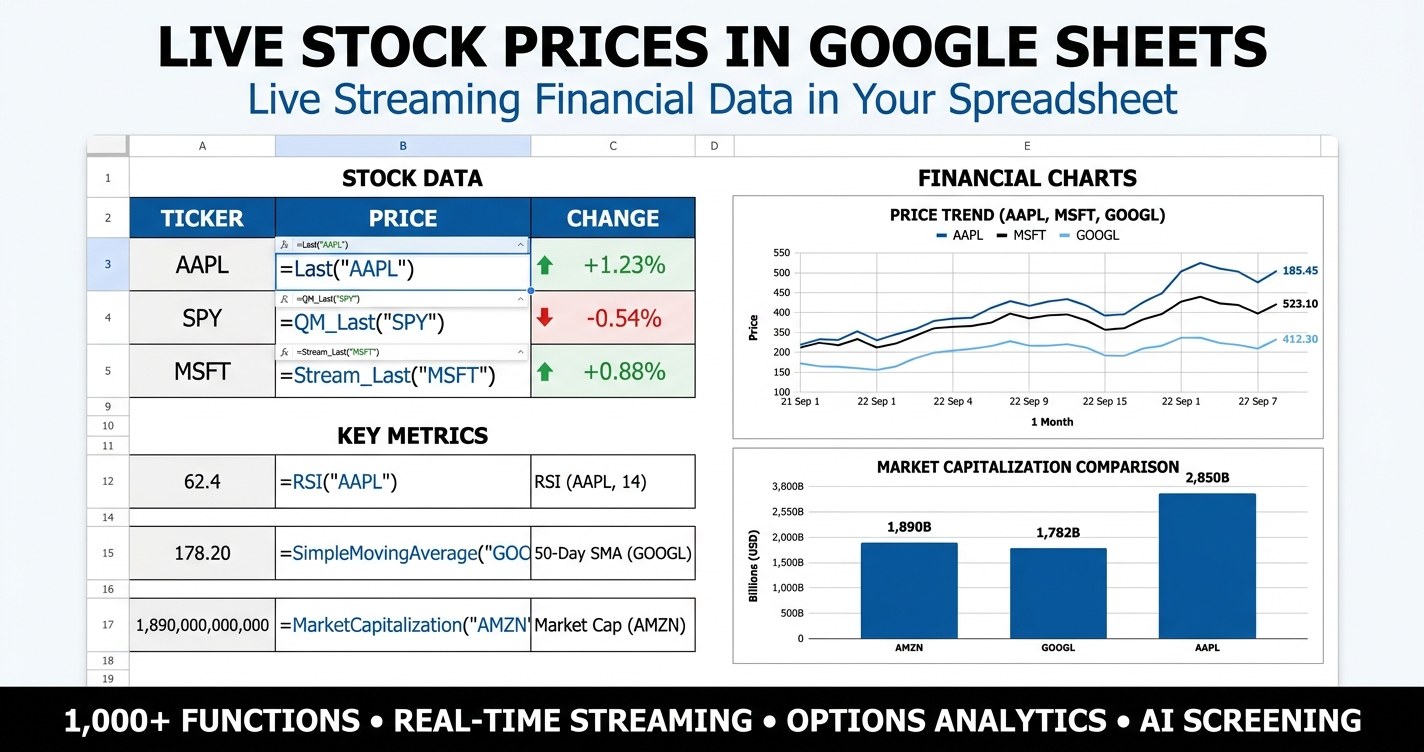
Live stock prices in Google Sheets sound simple until you push GOOGLEFINANCE past a small watchlist. This guide shows what GOOGLEFINANCE can and cannot deliver, how to map every common attribute to a MarketXLS formula, and how to set up a live, audit-friendly dashboard with downloadable templates.
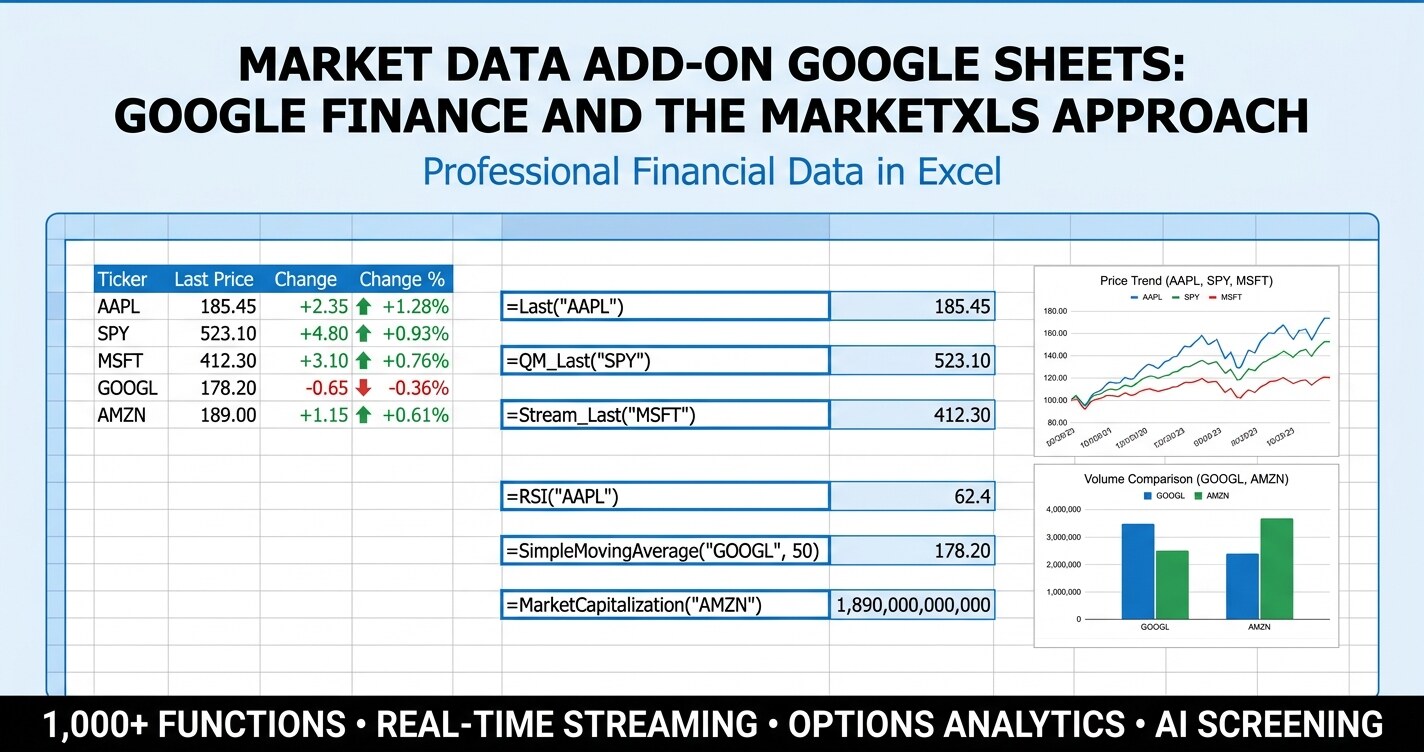
Market data add-on Google Sheets - Google Finance is the first stop and it is genuinely good. Here is what GOOGLEFINANCE does well, where it stops, and how MarketXLS extends Google Sheets and Excel into a full market data workstation.
Stock data in Google Sheets is one of the most useful free tools on the internet. Here is a complete guide to pulling live prices, fundamentals, and history with GOOGLEFINANCE, plus the rare cases where MarketXLS for Excel desktop becomes a natural next step.
Stock market data in Excel, pulled live with MarketXLS formulas for prices, daily change, moving averages, 52-week range, P/E, beta, dividend yield, and sector aggregates across 30 tickers.
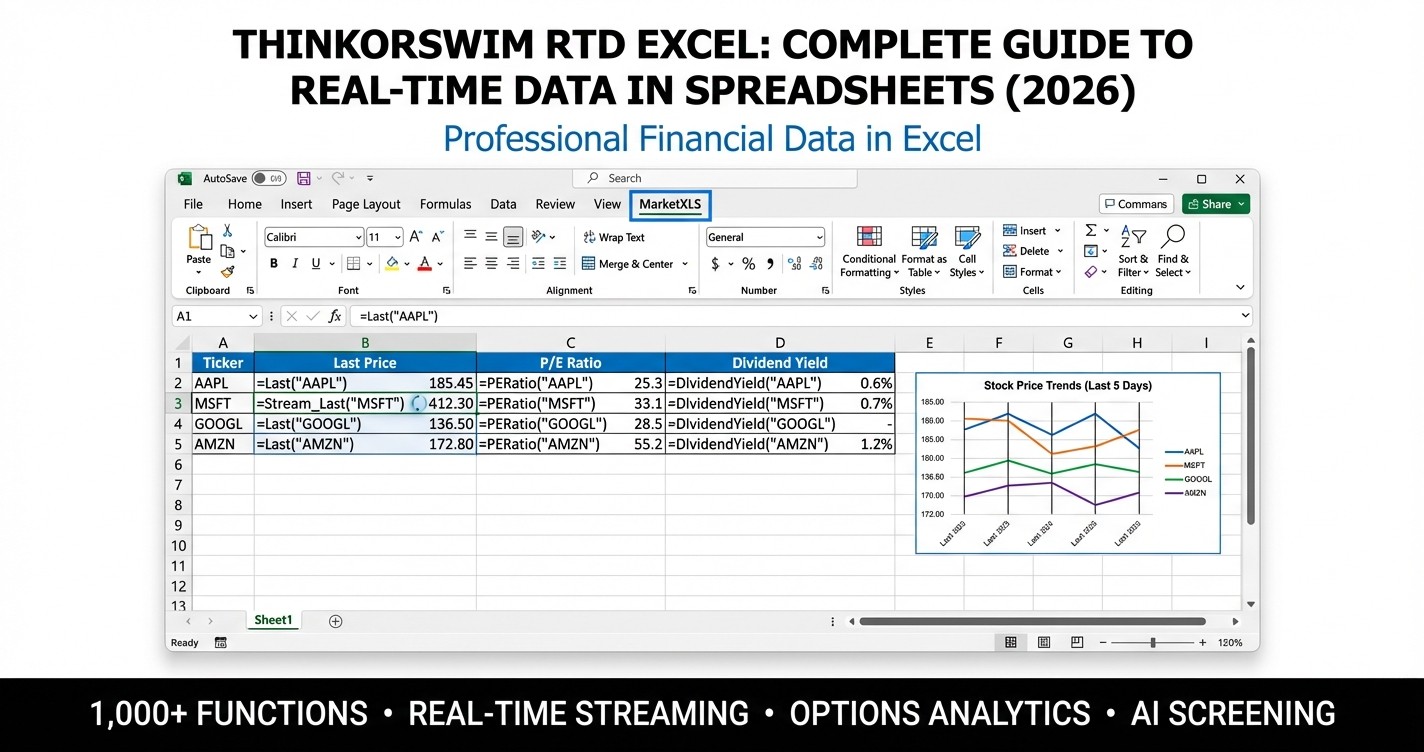
Thinkorswim RTD Excel - learn how to stream real-time market data into Excel using TOS RTD functions, compare RTD vs MarketXLS, and build powerful trading dashboards in 2026.
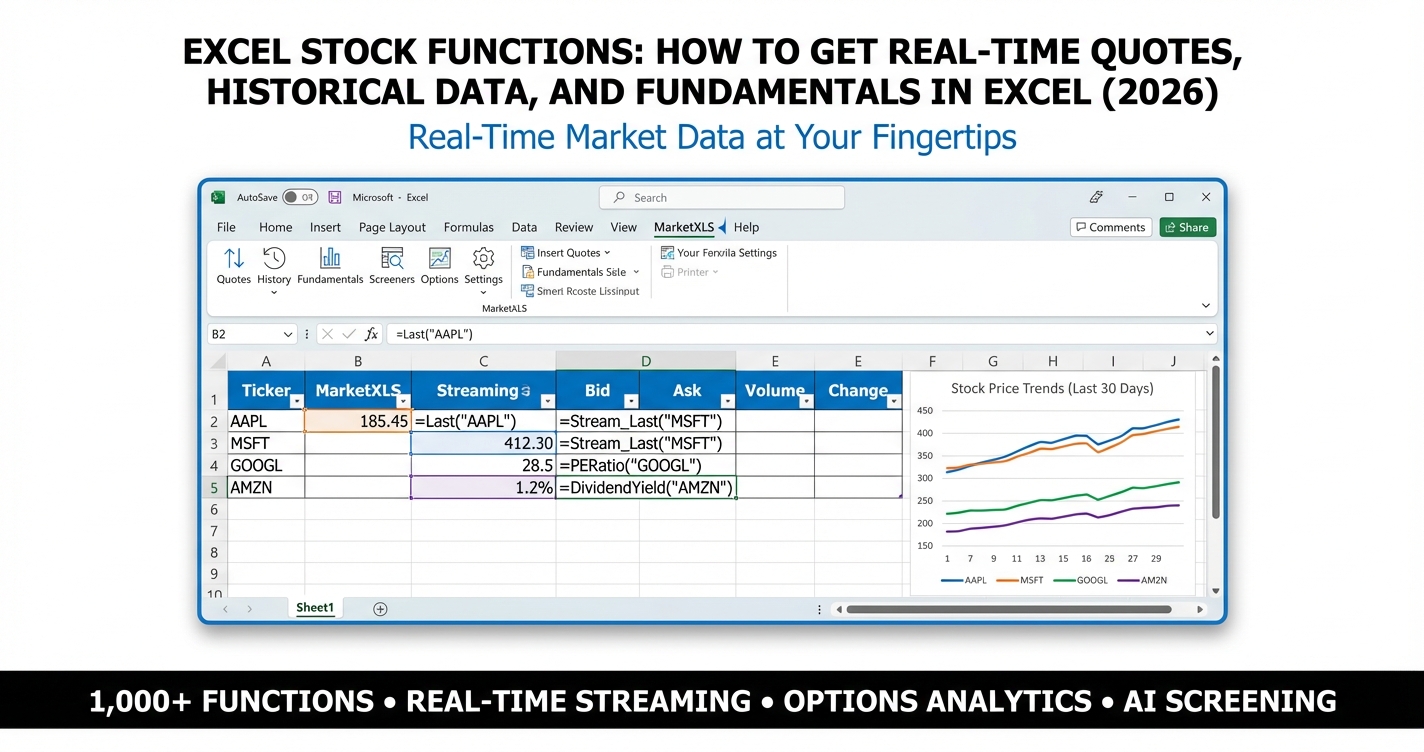
Excel stock functions - learn every method to get real-time stock quotes, historical prices, and fundamental data in Excel in 2026. Covers built-in STOCK data type, STOCKHISTORY, Power Query, and MarketXLS add-in formulas.
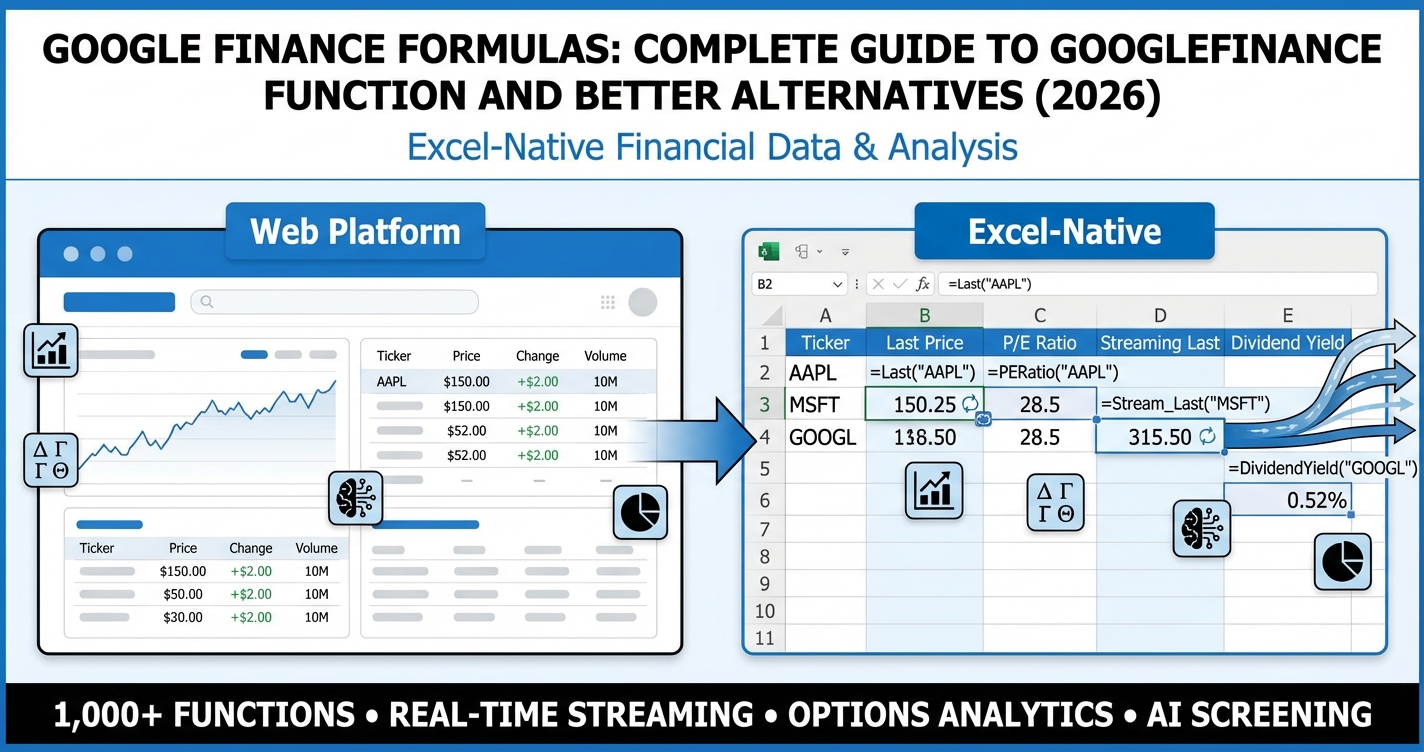
Google finance formulas - learn every GOOGLEFINANCE attribute, syntax, and limitation in 2026. Discover why MarketXLS with 1,000+ functions is the professional upgrade for Google Sheets and Excel users.
STOP Wasting Hours on Manual Data Entry & START Making Smarter Investment Decisions
Discover how 2,500+ serious investors are saving 15+ hours every week with real-time market data directly in Excel.
✓ No credit card required • ✓ 14-day money-back guarantee • ✓ Cancel anytime