

ROIC formula guide showing return on invested capital calculation and value creation interpretation
Portfolio & Investment Strategies
Expert insights on stock market analysis, investment strategies, and Excel techniques for smarter investing.
Browse articles by topic, arranged in reading order.
ROIC formula guide showing return on invested capital calculation and value creation interpretation
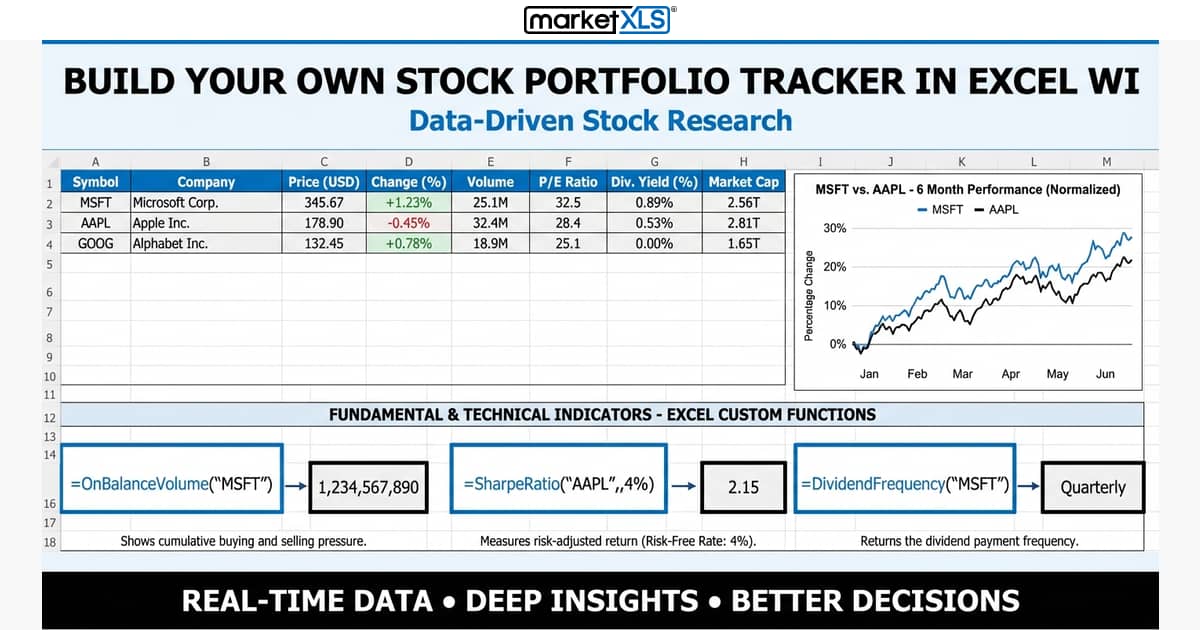
How to build a stock portfolio tracker in Excel: list your holdings, pull prices with MarketXLS formulas like =Last("AAPL"), and calculate value, gain, and return.

To get the next dividend you must buy a stock before its ex-dividend date. Pull ex-dates, pay dates, and yields for many stocks into Excel with MarketXLS formulas.

Stock beta in excel measures how volatile a stock is relative to the overall market — learn to calculate it manually with formulas and instantly with MarketXLS functions.

Get historical stock prices for many tickers in Excel with MarketXLS: =QM_GetHistory for a full price table, or =Close_Historical(ticker, date) for one date per cell.

A dividend calendar spreadsheet lists ex-dividend, record, and pay dates with expected amounts for each holding, so you can plan income and reinvestment.

A dividend calendar spreadsheet lists each holding with its ex-dividend date, pay date, frequency, and amount so you know when income arrives. How to build one with MarketXLS.

Terminal value formulas for a DCF: the perpetuity growth (Gordon) method and the exit multiple method, with the Excel formulas for each.

Dividend portfolio tracking in Excel lets you monitor yield, income, ex-dividend dates, and DRIP growth across all your holdings. Build a complete tracker with MarketXLS formulas.

Build a dividend calendar spreadsheet in Excel with ex-dividend date, pay date, frequency, dividend per share, and yield for each holding to forecast retirement income.
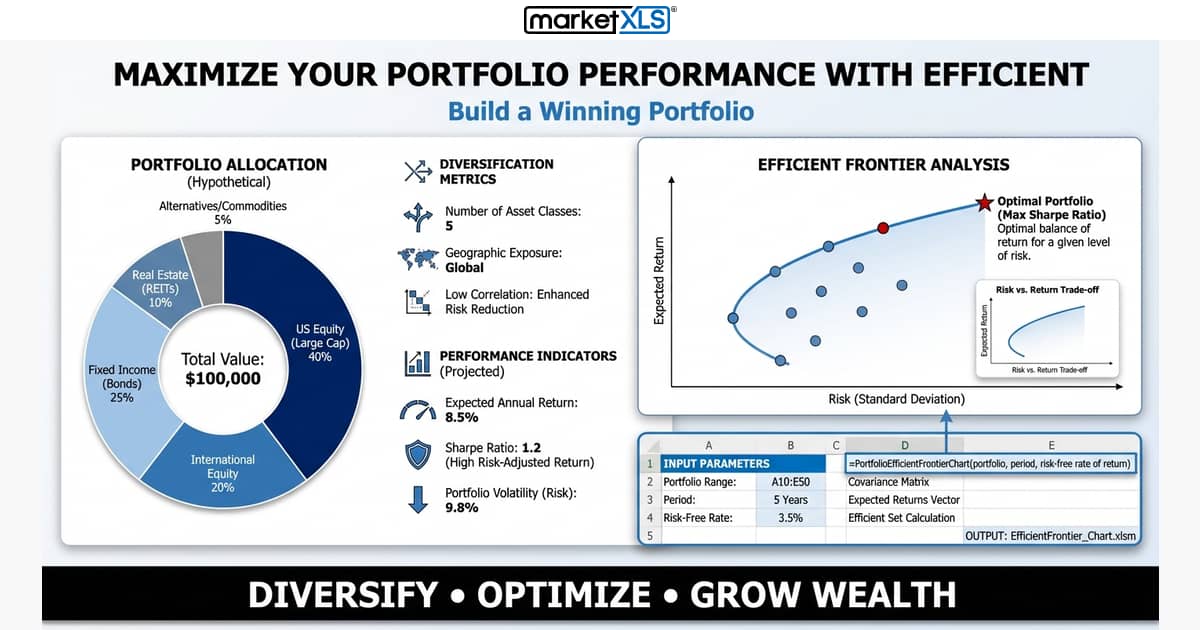
The efficient frontier is the set of portfolios with the highest expected return for each level of risk. How to plot it for your portfolio in Excel with MarketXLS.

MarketXLS Version 9.3.4.8 adds ThinkorSwim multileg strategies, dividend payout tracking, total returns, AI-powered Efficient Frontier, and more.
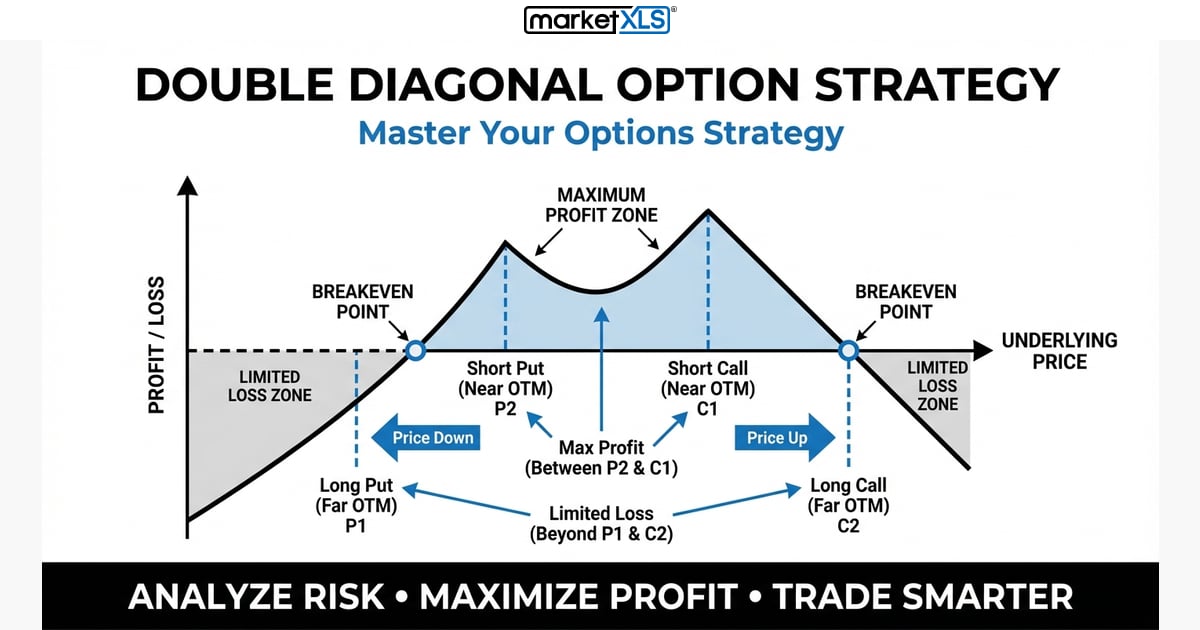
A double diagonal sells near-term OTM calls and puts and buys longer-dated, further OTM calls and puts. How it works, when to use it, Greeks, and exits.
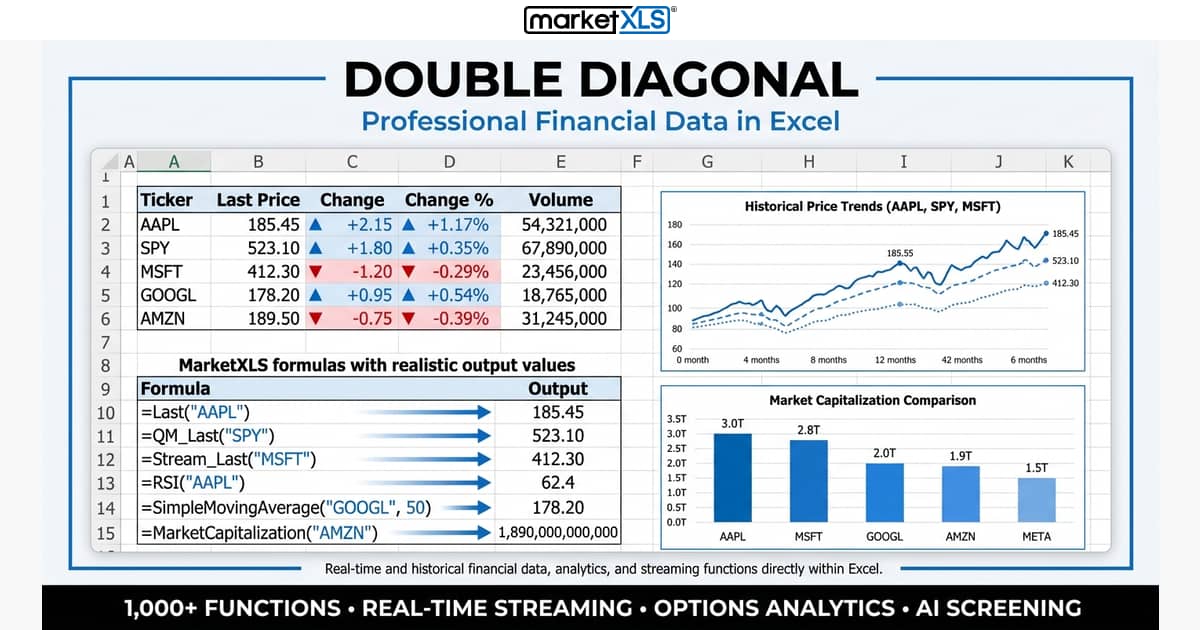
Double Diagonal option strategy combines calendar and vertical spreads for range-bound profit. Learn setup, risk/reward, Greeks management, adjustments, and how MarketXLS helps analyze this advanced strategy.

2 leg option strategies explained with all vertical spreads, straddles, strangles, and calendar spreads including setup, payoff calculations, Greeks, and Excel tracking with MarketXLS.
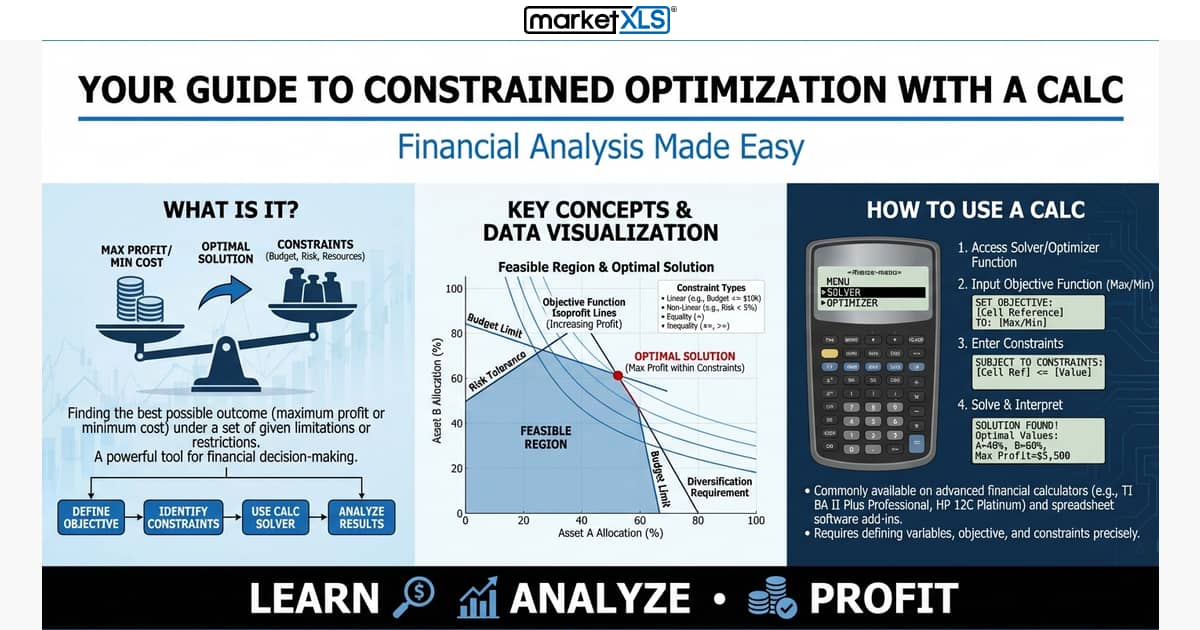
Constrained optimization finds the best outcome within limits, such as the highest-return portfolio under a risk cap. How it works and how to solve it with a calculator or Excel.
Live market data, stock screening, options analytics and portfolio management inside Excel.