
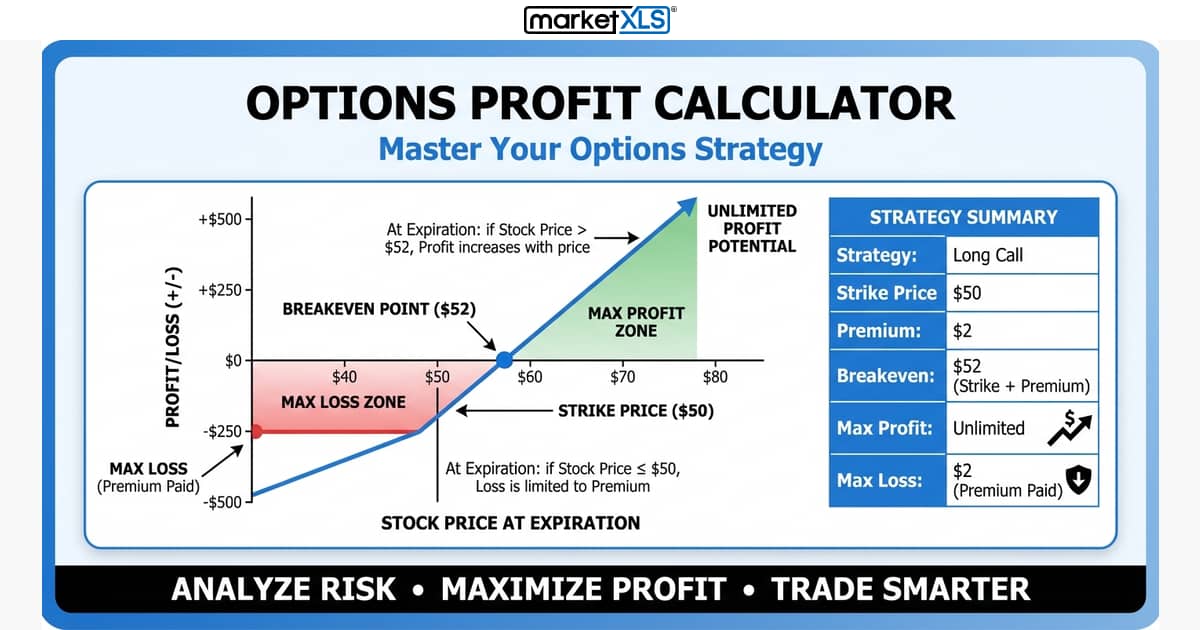
An options profit calculator shows the profit or loss of a call, put, or multi-leg strategy at expiry and before it. How the math works and the MarketXLS Excel template.
Options Trading
An options profit calculator shows the profit or loss of a call, put, or multi-leg strategy at expiry and before it. How the math works and the MarketXLS Excel template.
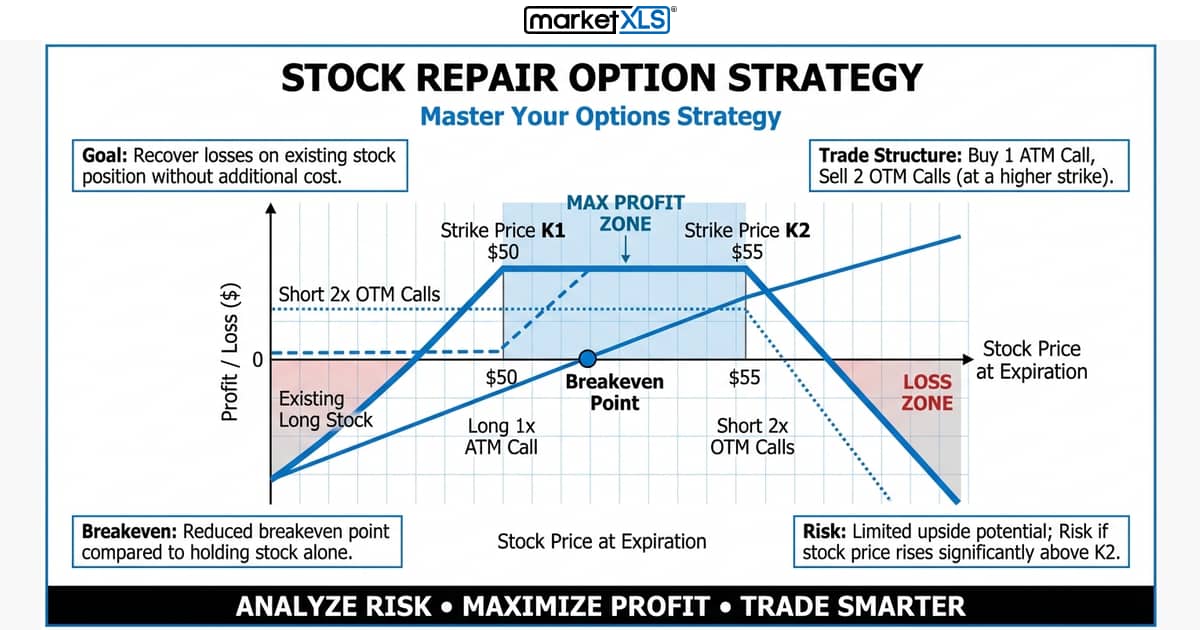
The stock repair strategy buys one at-the-money call and sells two higher-strike calls against a losing stock position to lower the breakeven at little or no extra cost.
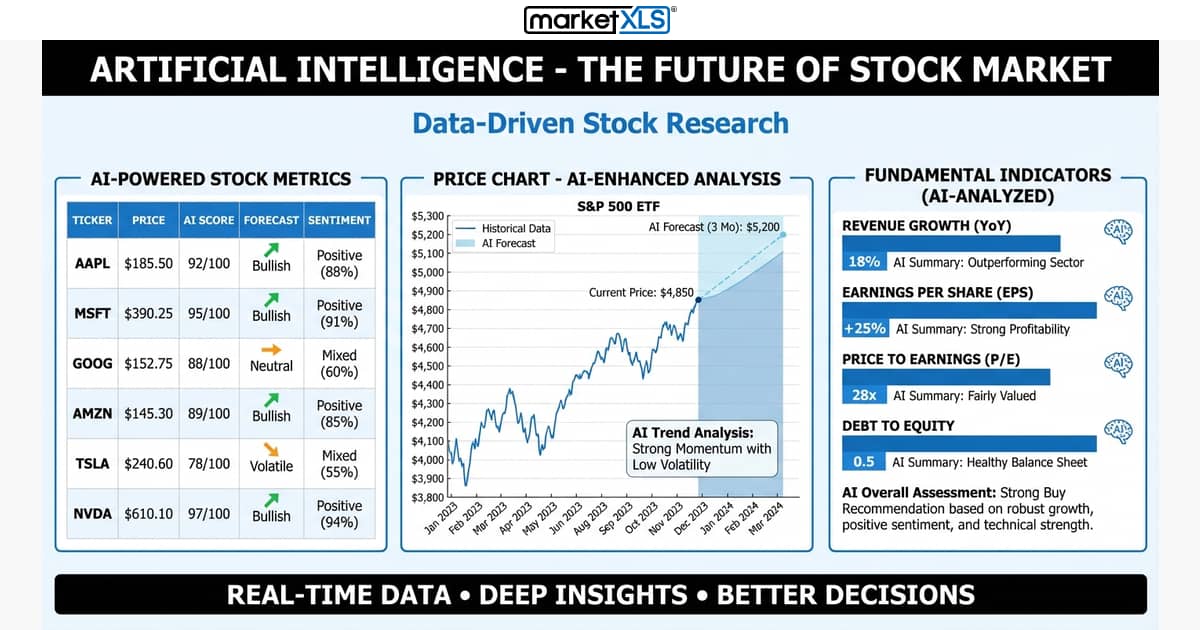
AI in stock markets infographic showing sentiment analysis, algo trading, pattern recognition, and risk management
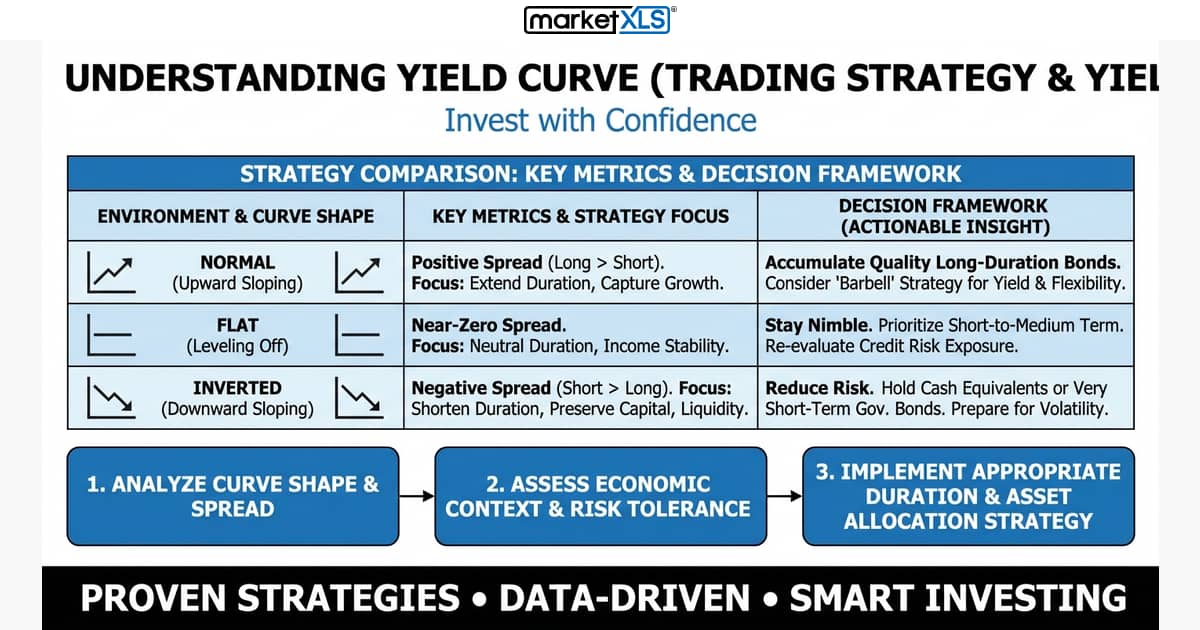
A yield curve plots bond yields against maturity. How normal, flat, and inverted curves differ, riding the yield curve, and yield curve control.
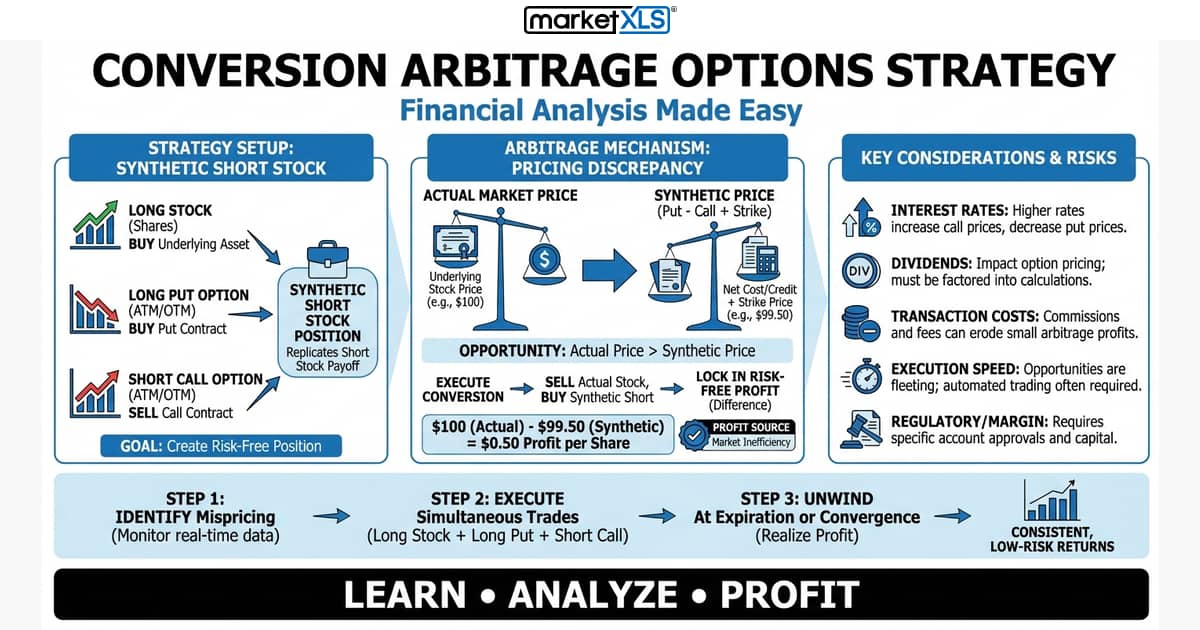
Conversion arbitrage studies put-call parity mispricings for potential profit, subject to trading costs and execution risks. Learn how conversion and reverse conversion strategies work, with real P&L examples and MarketXLS Excel formulas.
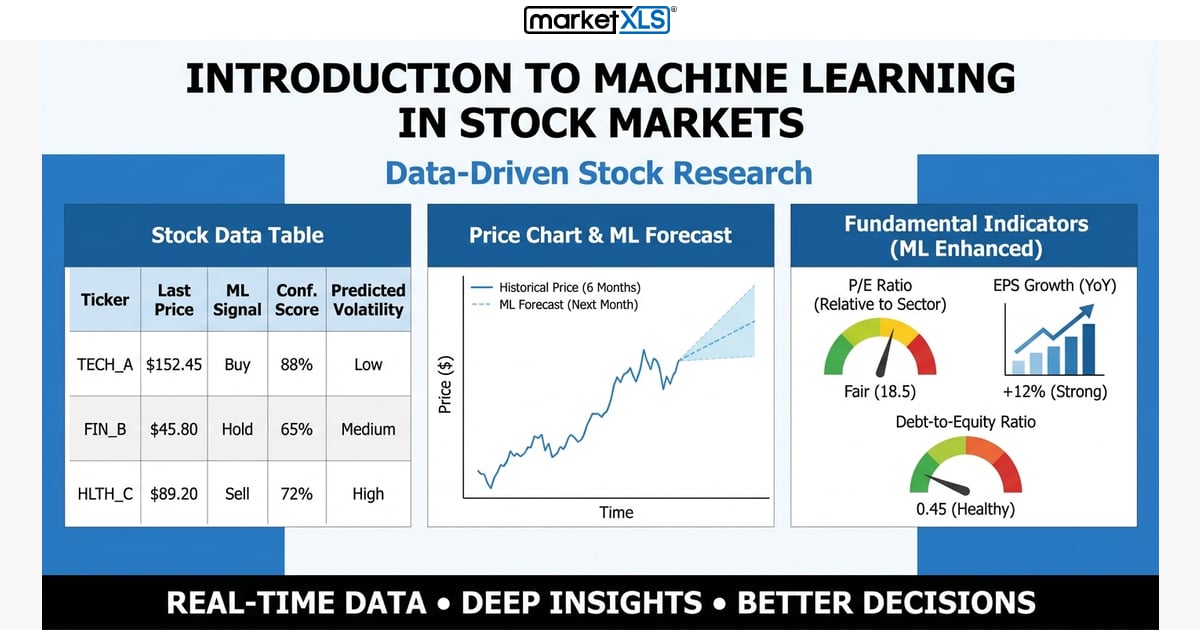
How machine learning is used in the stock market (forecasting, screening, portfolio risk, automated execution), its main limitations, and examples.
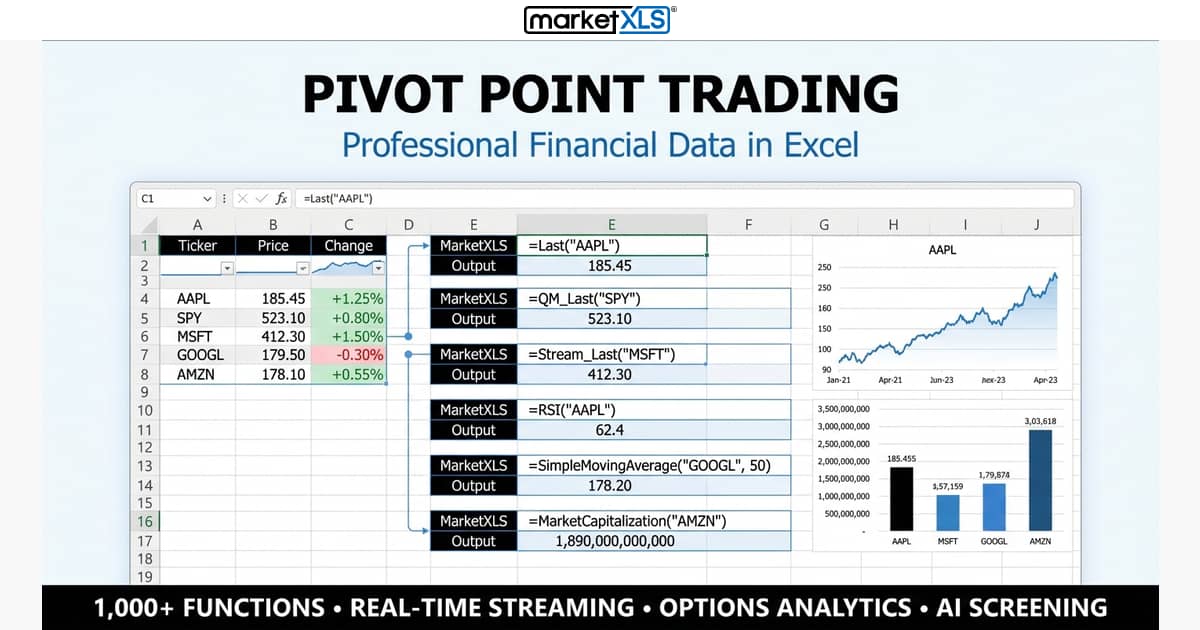
A pivot point is (prior high + low + close) / 3; support and resistance levels are derived from it. How to calculate standard, Woodie, Camarilla, and Fibonacci pivots in Excel.
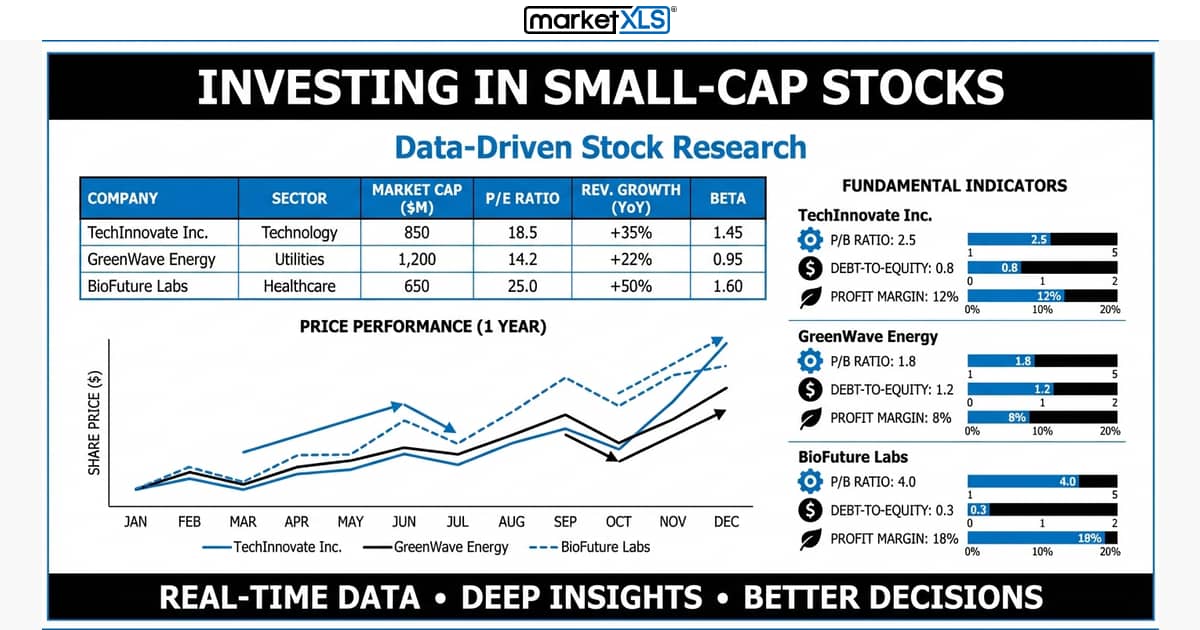
Small-cap stocks are companies worth roughly $300 million to $2 billion. How they compare with mid and large caps, their risks, and small-cap ETFs (data as of May 2021).
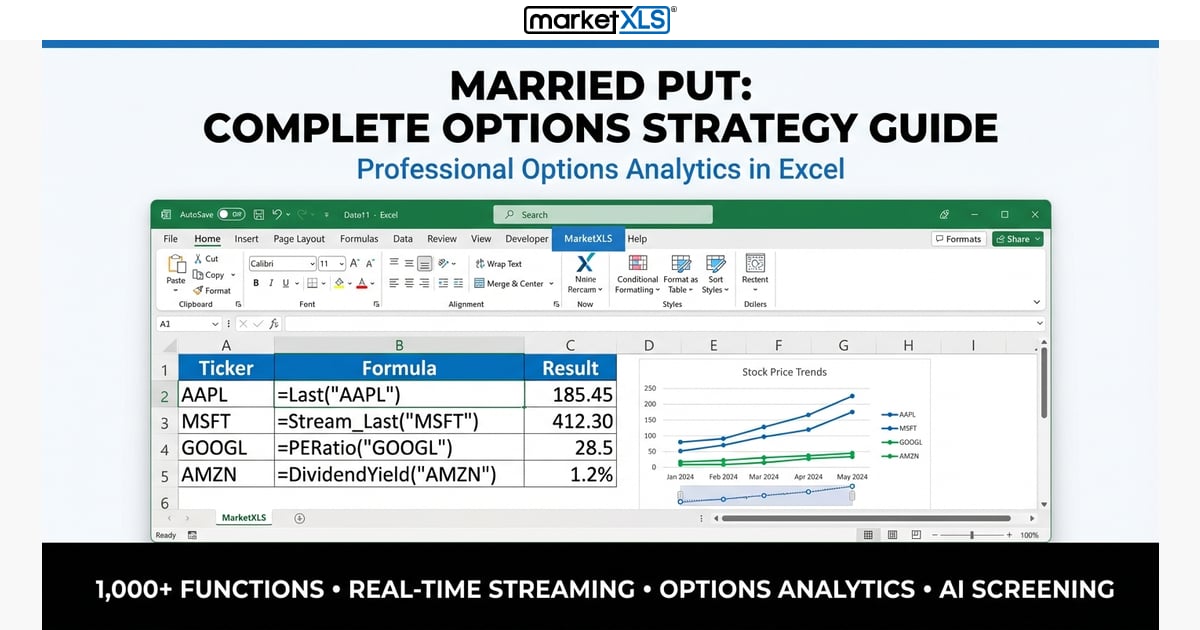
Married put strategy explained with setup, cost analysis, and real MarketXLS formulas. Learn how to protect stock positions using puts, compare with protective puts, and manage risk in Excel.
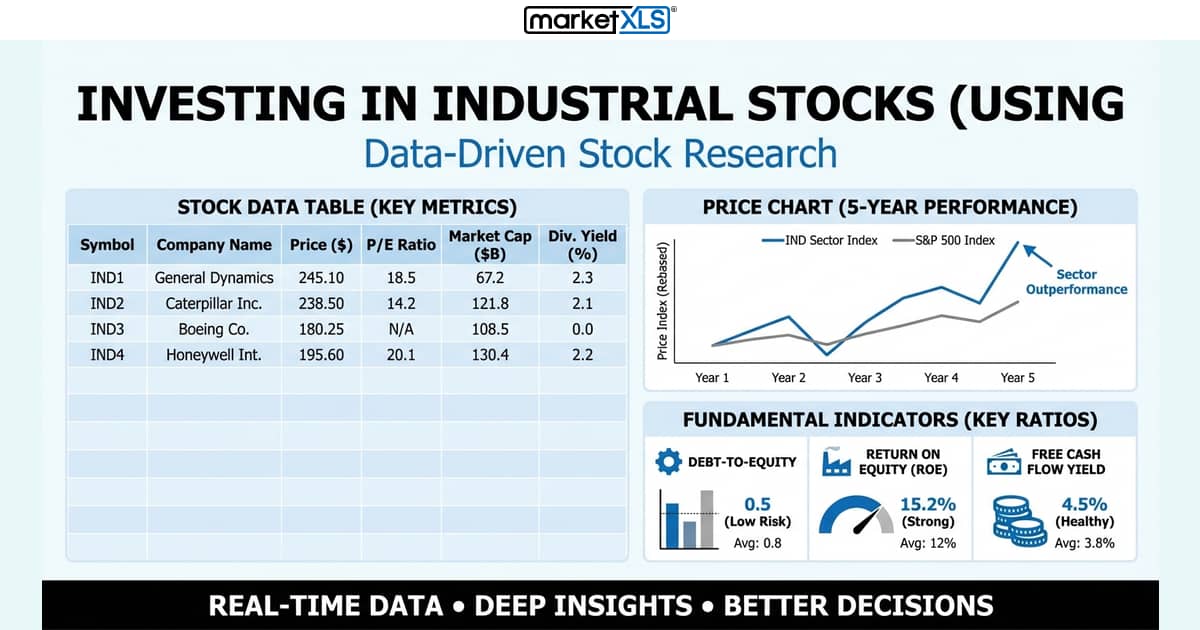
What the industrial sector includes, example industrial stocks and ETFs (XLI, VIS), the pros and cons of investing, and how to compare companies in Excel.
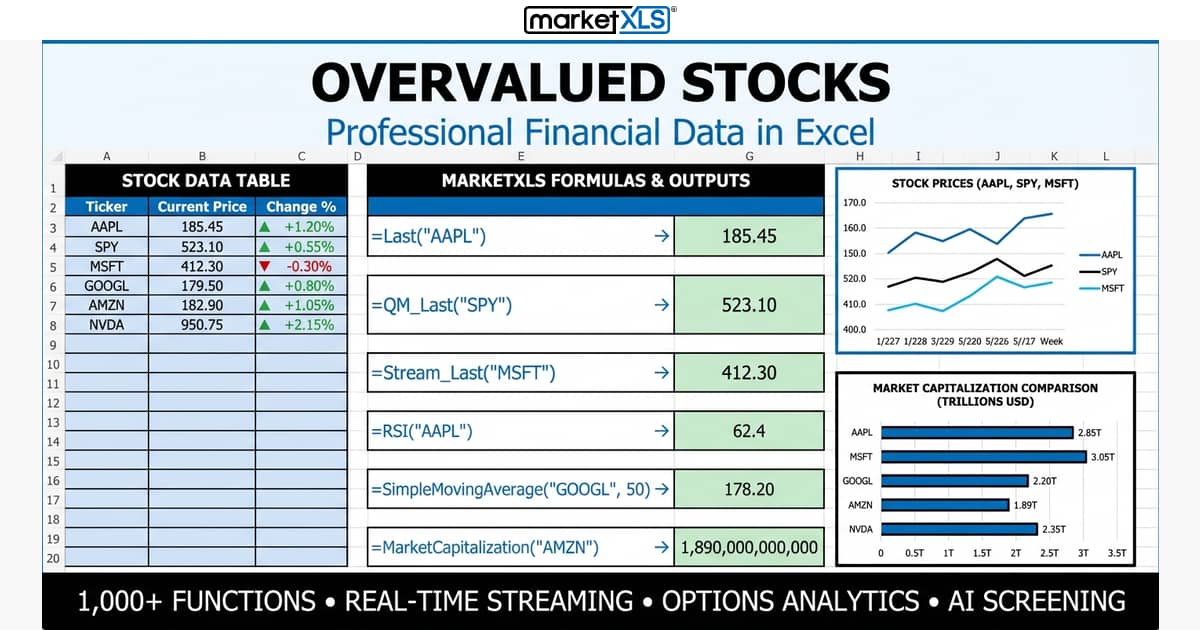
Overvalued stocks trade above their intrinsic value and can expose investors to significant downside risk. Learn how to identify overvalued stocks using valuation metrics, screening methods, and MarketXLS Excel formulas.

The stock replacement options strategy means buying a deep in-the-money call (delta close to 1) instead of buying 100 shares.

Basic Materials Sector includes companies involved in mining, chemicals, forestry, and construction materials. Learn how to analyze basic materials stocks, top ETFs, and use MarketXLS to research this cyclical sector.
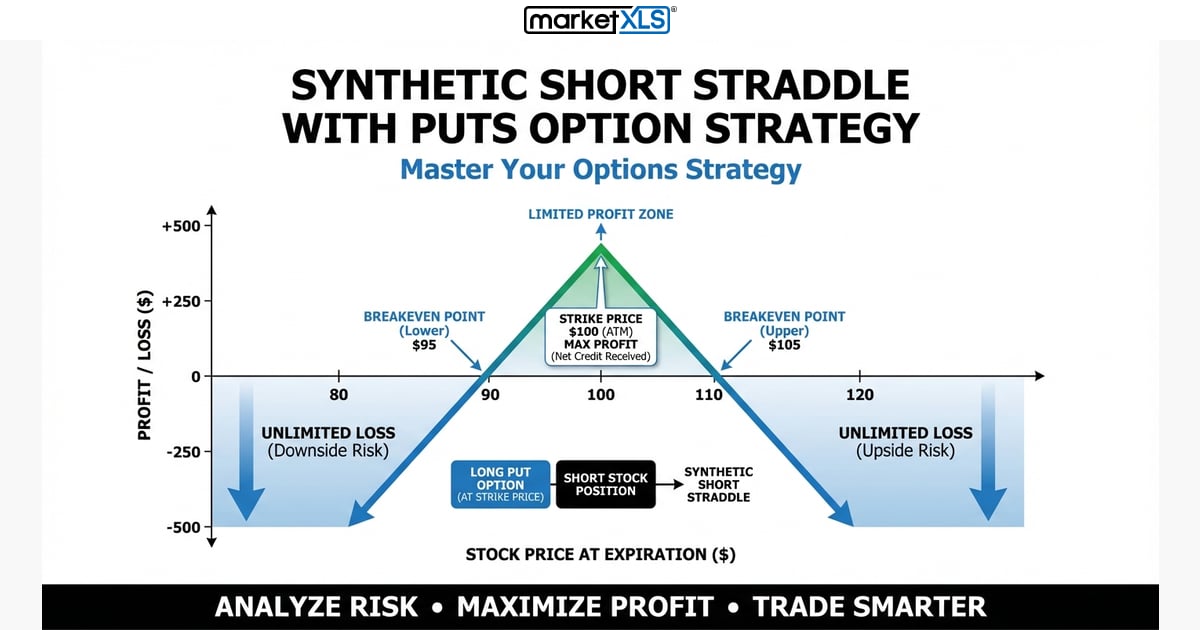
A synthetic short straddle with puts shorts 100 shares and sells two at-the-money puts. Setup, maximum profit, unlimited risk, breakevens, and an Excel template.
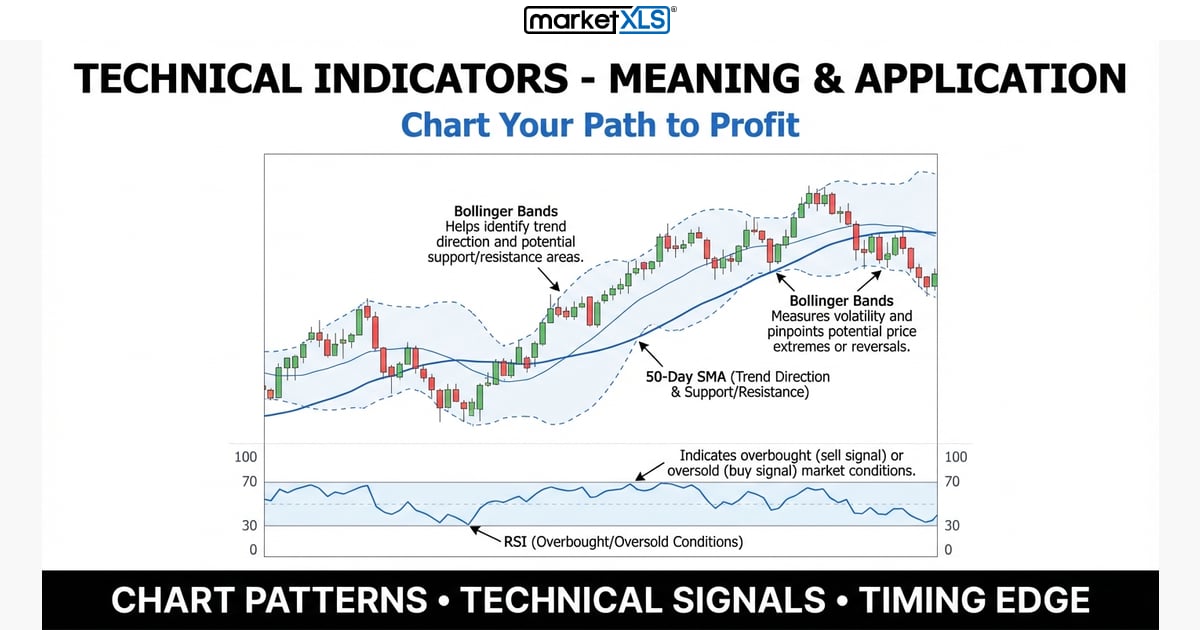
Technical indicators are formulas applied to past price and volume. What Bollinger Bands, SMA, EMA, golden and death crosses, MACD, and RSI measure and how traders read them.
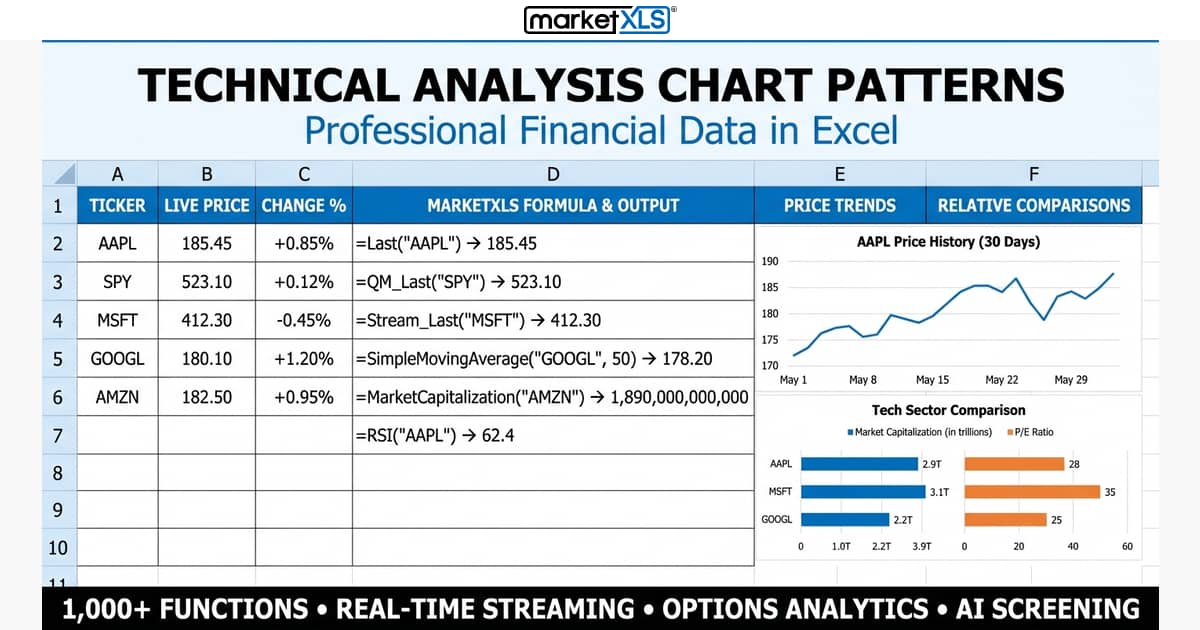
Chart patterns (head and shoulders, double tops, triangles, flags, candlesticks) and how to find, confirm, and backtest them in Excel with price history and RSI.
Browse articles by topic, arranged in reading order.
Live market data, stock screening, options analytics and portfolio management inside Excel.