Option Chain Matrix
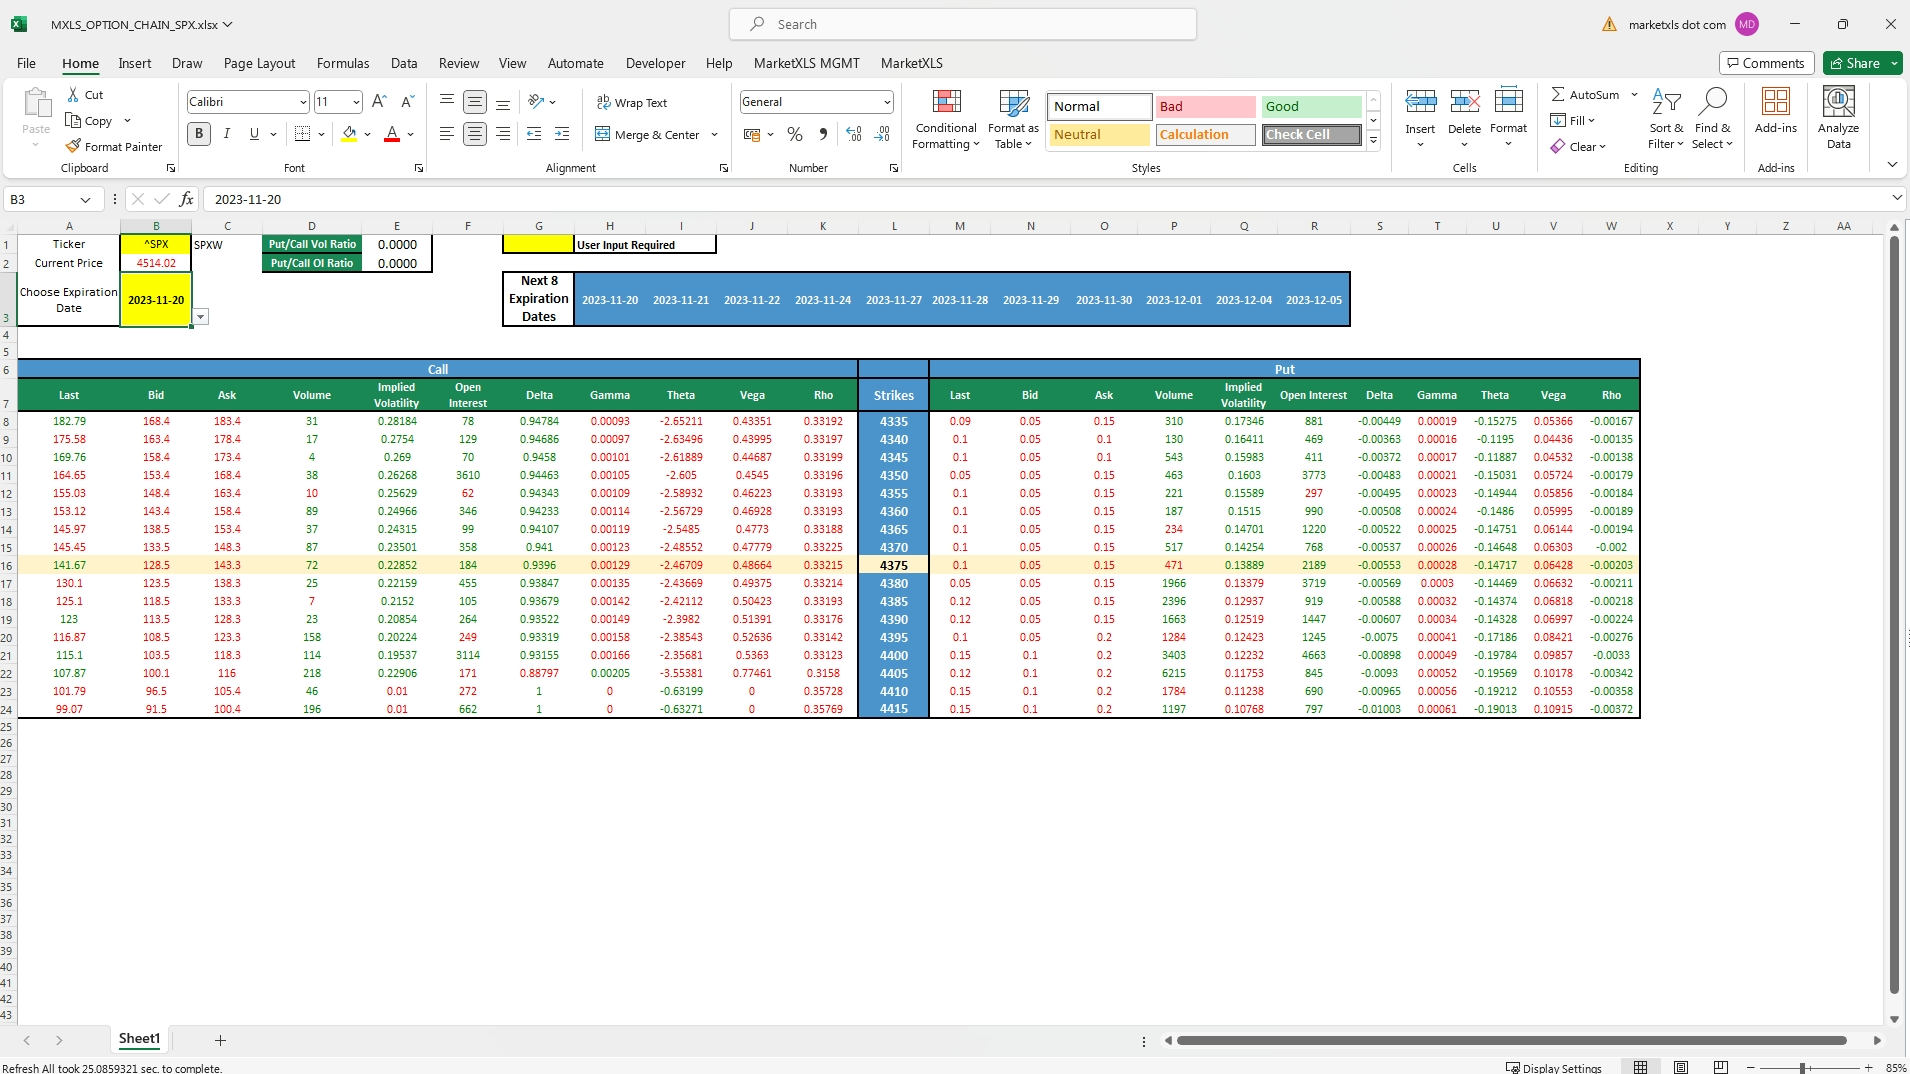
The Option Chain Matrix is a comprehensive, in-depth tool for traders and investors that provides them with detailed information about the bid offerings for specific expiration dates on various financial assets. This can assist them in making informed financial decisions.
Let me present a detailed description with an example. In this example, the Matrix is set up to display bid values for a wide range of expiration dates. These dates, starting from 2023-11-10 and ending on 2024-03-15, are listed horizontally across the top of the matrix. The column below each date shows the corresponding bid prices at different strike prices (ranging from 130 to 260).
Moreover, the "DTE" row represents 'Days to Expiration' - which indicates the remaining days until the date of expiry arrives. The "WeekDay" row with the number 5 signifies that all the expiration dates fall on a weekday.
For each expiration date, the listed bid prices reflect the premium an investor would have to pay for each option contract at different strike levels, ranging from 130 to 260. For instance, if you take a look at the expiration date 2023-11-24, the bid prices increase as the strike prices increase - indicating how much an investor should expect to pay in premiums for these options.
Notably, some of the bid values are marked in bold, highlighting the strong bids for those particular expiration dates and strike prices.
In addition to the listed bid values, the opportunity to add additional trading information is also available with this matrix. You can include Delta, IV (Implied Volatility), and costs to open a trade, as per your requirements, which enables users to get a quick glance at a multitude of important trading data in one place.

Created by: Nikita

I invite you to book a demo with me or my team to save time, enhance your investment research, and streamline your workflows.