MarketPulse Dashboard
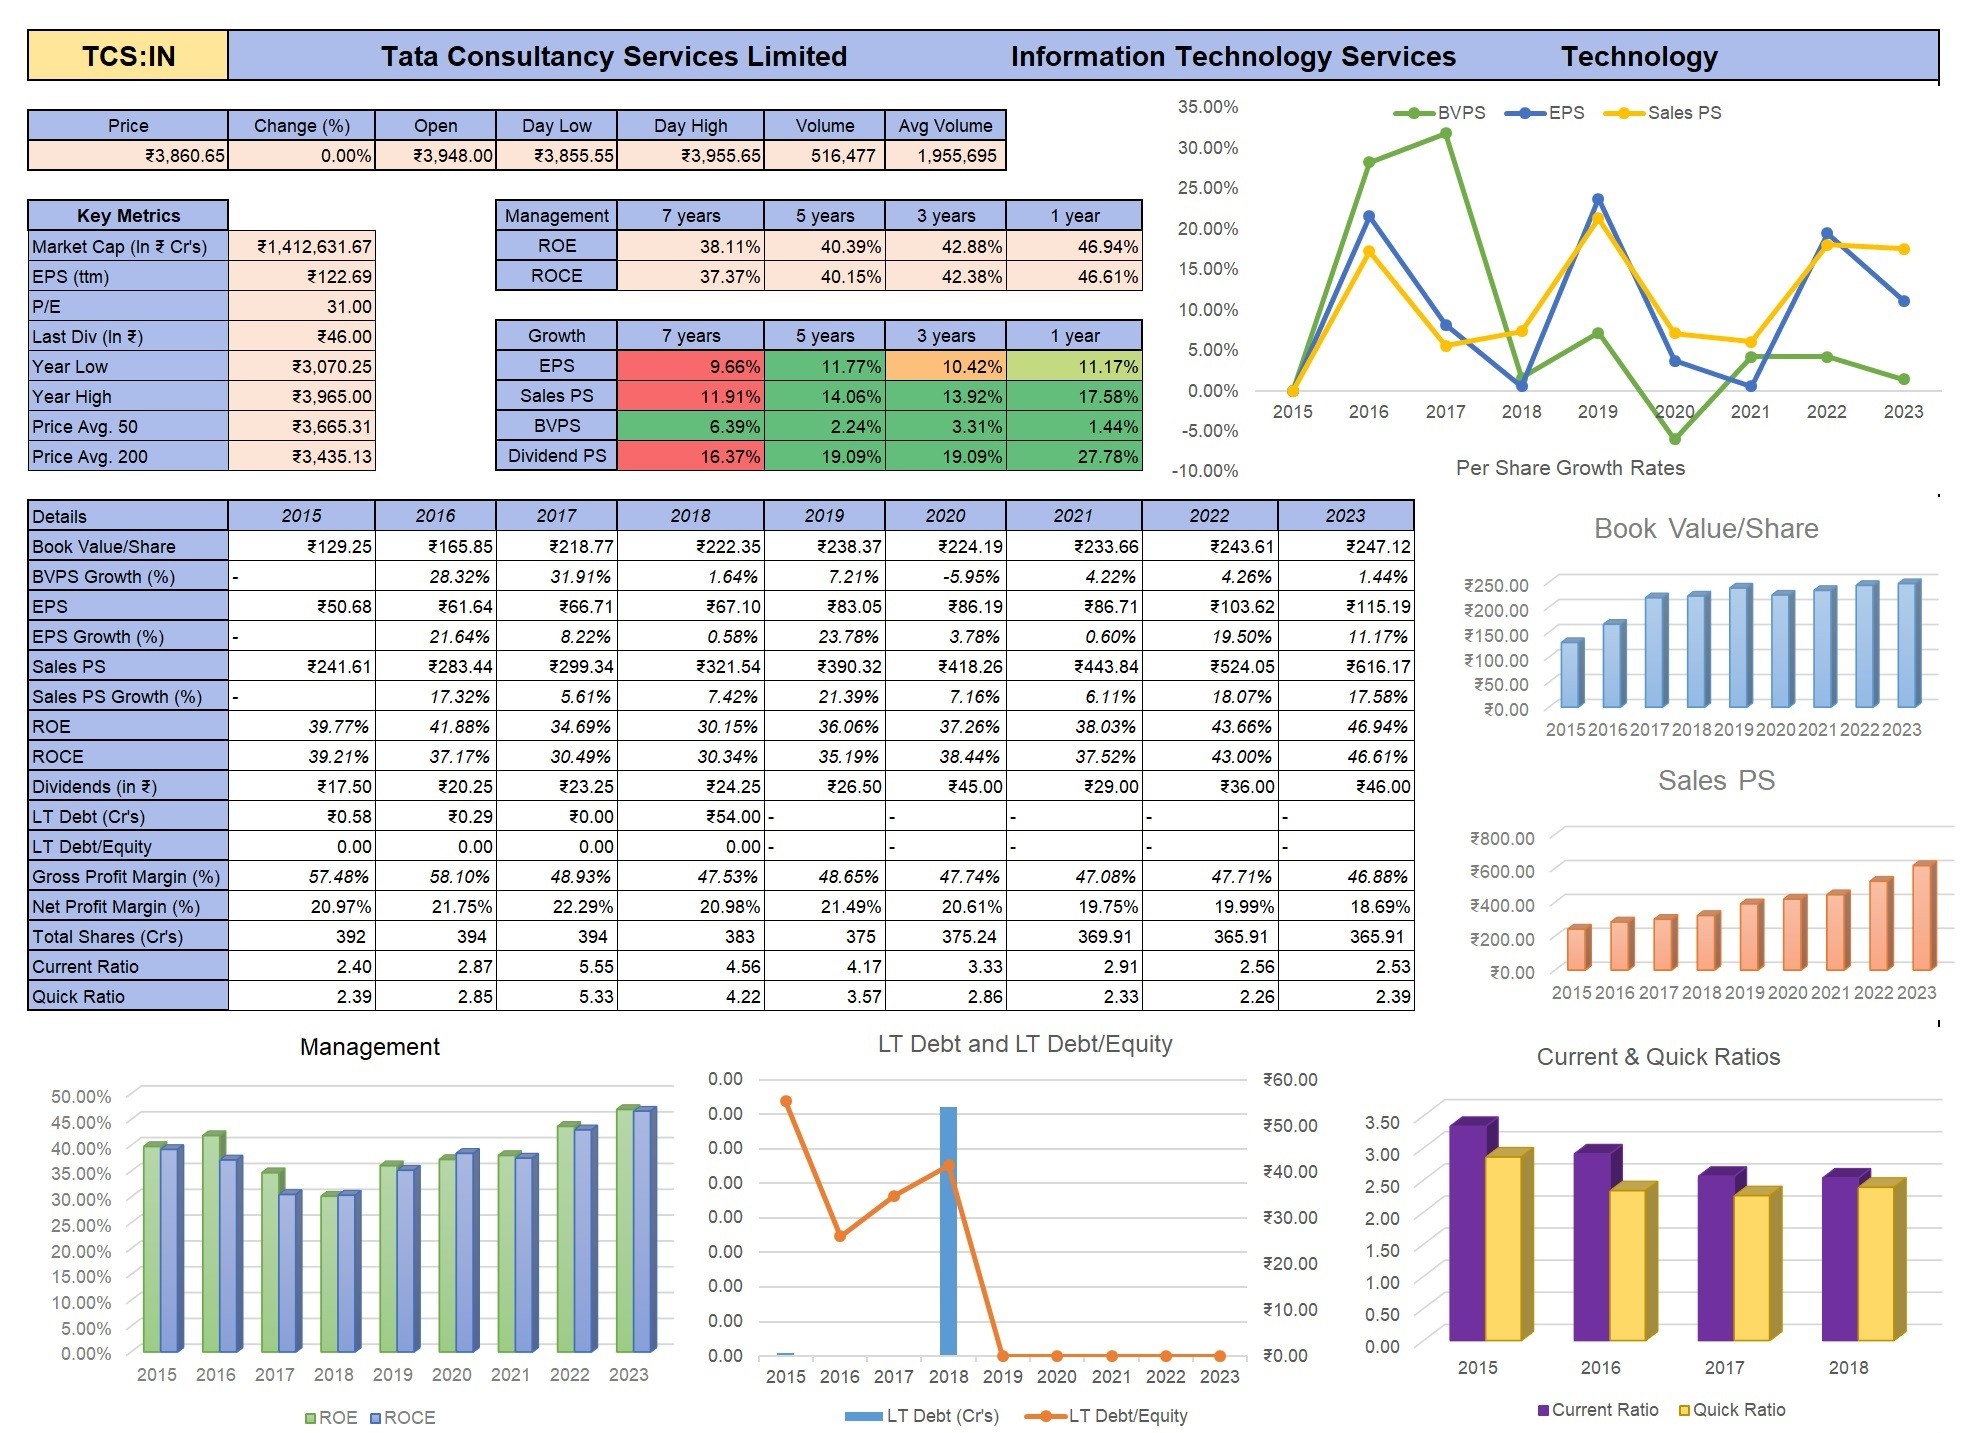
The "MarketPulse Dashboard" is a cutting-edge portfolio analysis instrument, specifically crafted to offer a detailed, in-depth examination of the performance of a vast array of exchange-traded funds (ETFs) to its investors.
This is a breakdown of the dashboard’s features:
1. ETF Snapshot: The dashboard displays the day's performance metrics of prominent indices and ETFs, providing an immediate interpretation of pertinent market trends. It includes the day's price, rate of change, and a snapshot of volatility and volume, furnishing investors with a quick visual summary of the market activities.
2. Historical Performance Metrics: The dashboard offers a spectrum of historical data points spanning multiple timeframes such as 1-week, 4-week, 2-day, 7-days, 30-days, 6-months, and 1-year, delivering a valuable timeline of performance and trending patterns.
3. Volatility and Risk Indicators: Key metrics such as standard deviation and beta are incorporated to measure the volatility and systematic risk of each ETF compared to the overall market, assisting investors in gaining a better understanding of each investment's risk-return profile.
4. Volume Statistics: Trading volume statistics are readily provided as an indication of liquidity and investor interest, enhancing the data with daily volume averages over multiple periods.
5. Dividend Information: The dashboard also furnishes information about dividend yields, providing valuable insights into the income-generating potential of the ETFs.
6. Categorical Breakdown: ETFs are systematically categorized by sectors and styles, such as small-cap growth or value, enabling investors to examine performance from a market segment perspective.
To its users, this dashboard is a potent analytical tool that affords the equivalent of a financial analyst's insights at their disposal. The information it delivers is critical for strategizing, such as reorganizing a portfolio, identifying growth prospects, or understanding sector advantages and disadvantages within the broader market landscape. It offers significant utility for illustrating a diversified portfolio's allocation and performance trajectory over time and for juxtaposing the past and present performances of various market components.
This dashboard incorporates essential metrics like value at risk, portfolio volatility, and the efficient frontier, granting investors access to sophisticated analytical capacities formerly reserved for portfolio managers. By democratizing complex analytics, this dashboard empowers investors to make insightful decisions that align perfectly with their financial aims and risk acceptance levels.

Created by: Shubham Shah

I invite you to book a demo with me or my team to save time, enhance your investment research, and streamline your workflows.


![Fundamental Data - Nifty Pharma Example [YT India Video 8.4] Fundamental Data - Nifty Pharma Example [YT India Video 8.4]](https://marketxls-client.s3.us-east-2.amazonaws.com/1708797081080/cropped_image.png)


