Nifty MAX Pain Calculator - Excel
At MarketXLS, we have developed an Excel template that enables you to calculate the Max Pain for Nifty or any other Indian stock or index. The template utilizes specific formulas to process option data:
=StrikeNext($B$4,S9): This formula is likely designed to identify the next strike price relevant to the calculations or the next expiration date based on the current stock/index symbol referenced in cell B4.=opt_TotalOpenInterestOptions($B$4,"Call",$B$5,A9): This MarketXLS function calculates the total open interest for call options for the given ticker symbol and expiration date. It’s a custom function that aggregates open interest data for all call options at different strike prices.=opt_TotalOpenInterestOptions($B$4,"Put",$B$5,A9): Similar to the previous function but for put options, this MarketXLS function calculates the total open interest for put options.=ExpirationNext(B4,0): This formula finds the next expiration date for the options of the stock or index symbol provided in cell B4.
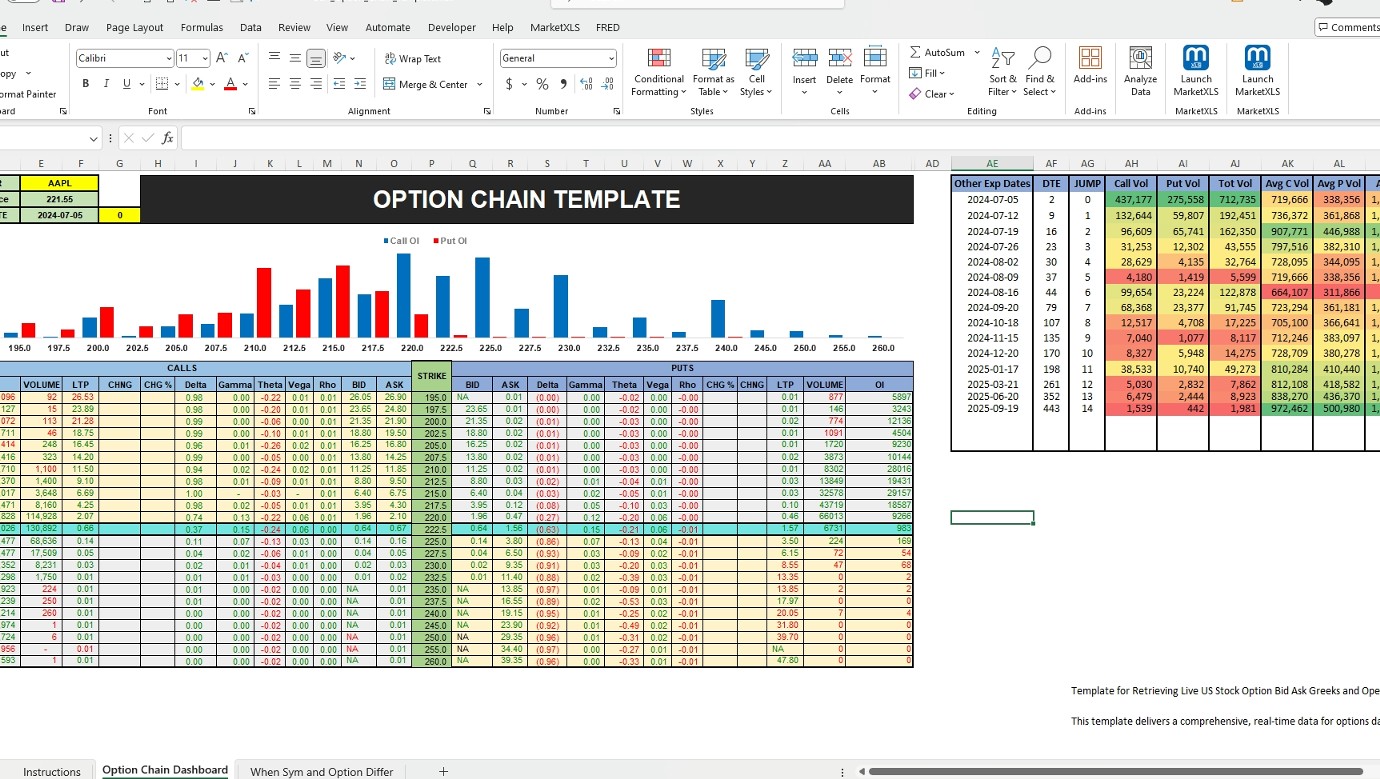
Using these MarketXLS functions, the template fetches the latest open interest data across various strike prices and calculates the respective "pain" for call and put options. The Max Pain point is determined by finding the strike price where the sum of pain for calls and puts is minimized, suggesting a price level where the most options expire worthless.
Traders can use this template by inputting the ticker symbol and expiration date, and the template will display the calculated Max Pain, helping to inform their trading decisions based on this popular theory. It is a powerful tool for those looking to understand potential market movements around option expirations.

Created by: Ankur

I invite you to book a demo with me or my team to save time, enhance your investment research, and streamline your workflows.