Real-Time Analysis: Options with Highest Open Interest, Change, and Volume
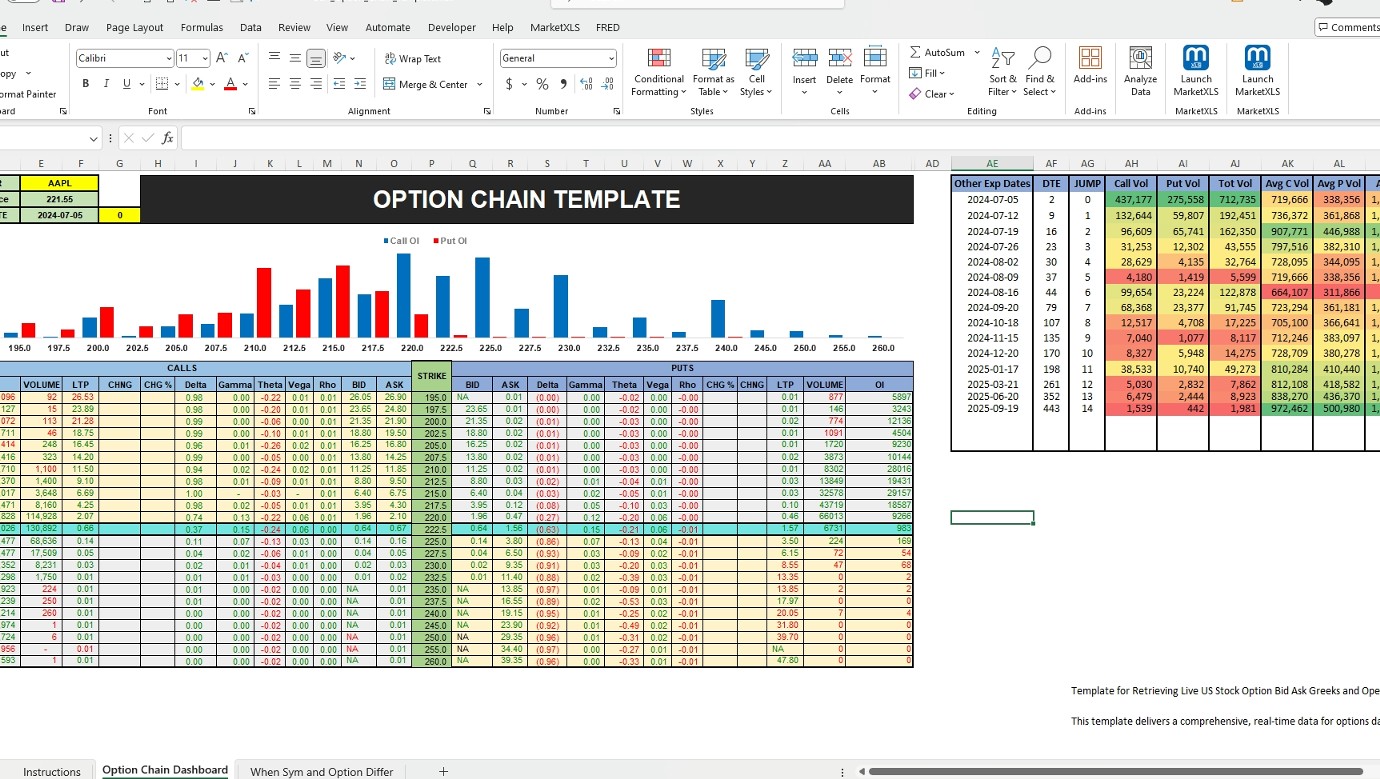
High volume, open interest, and significant price changes in options trading are pivotal indicators that can help traders decipher underlying market dynamics and investor sentiment. High trading volume signifies a robust interest in a specific option, often hinting at upcoming news, earnings announcements, or economic data that might significantly affect the stock’s value. Increased activity might also indicate a higher level of liquidity, enabling easier entry and exit for traders, which in turn attracts even more participants due to reduced slippage costs.
Open interest, which represents the total number of outstanding options contracts that have not been settled, provides insights into the flow of money into and out of the market. A rising open interest generally suggests new money is coming into the market, indicating that the current price trend may continue. For example, increasing open interest in call options might suggest a bullish outlook among investors, while rising open interest in put options might indicate bearish sentiment.
Price changes in options are also telling. A significant increase in the price of call options could suggest that investors are anticipating a rise in the underlying stock's price. Conversely, a surge in put option prices might reflect expectations of a decline. Large swings in option prices can also point to increased volatility in the underlying asset, potentially offering lucrative opportunities for traders to capitalize on rapid price movements.
Together, these indicators not only reflect current conditions but can also forecast future market movements. By analyzing these elements, traders can better position themselves in the market, aligning their strategies with perceived trends and investor behaviors. This approach is critical for anyone looking to enhance their trading efficacy and capitalize on the complex yet rewarding options market.

Created by: Nikita Dugar

I invite you to book a demo with me or my team to save time, enhance your investment research, and streamline your workflows.