Equity Research Dashboard Template
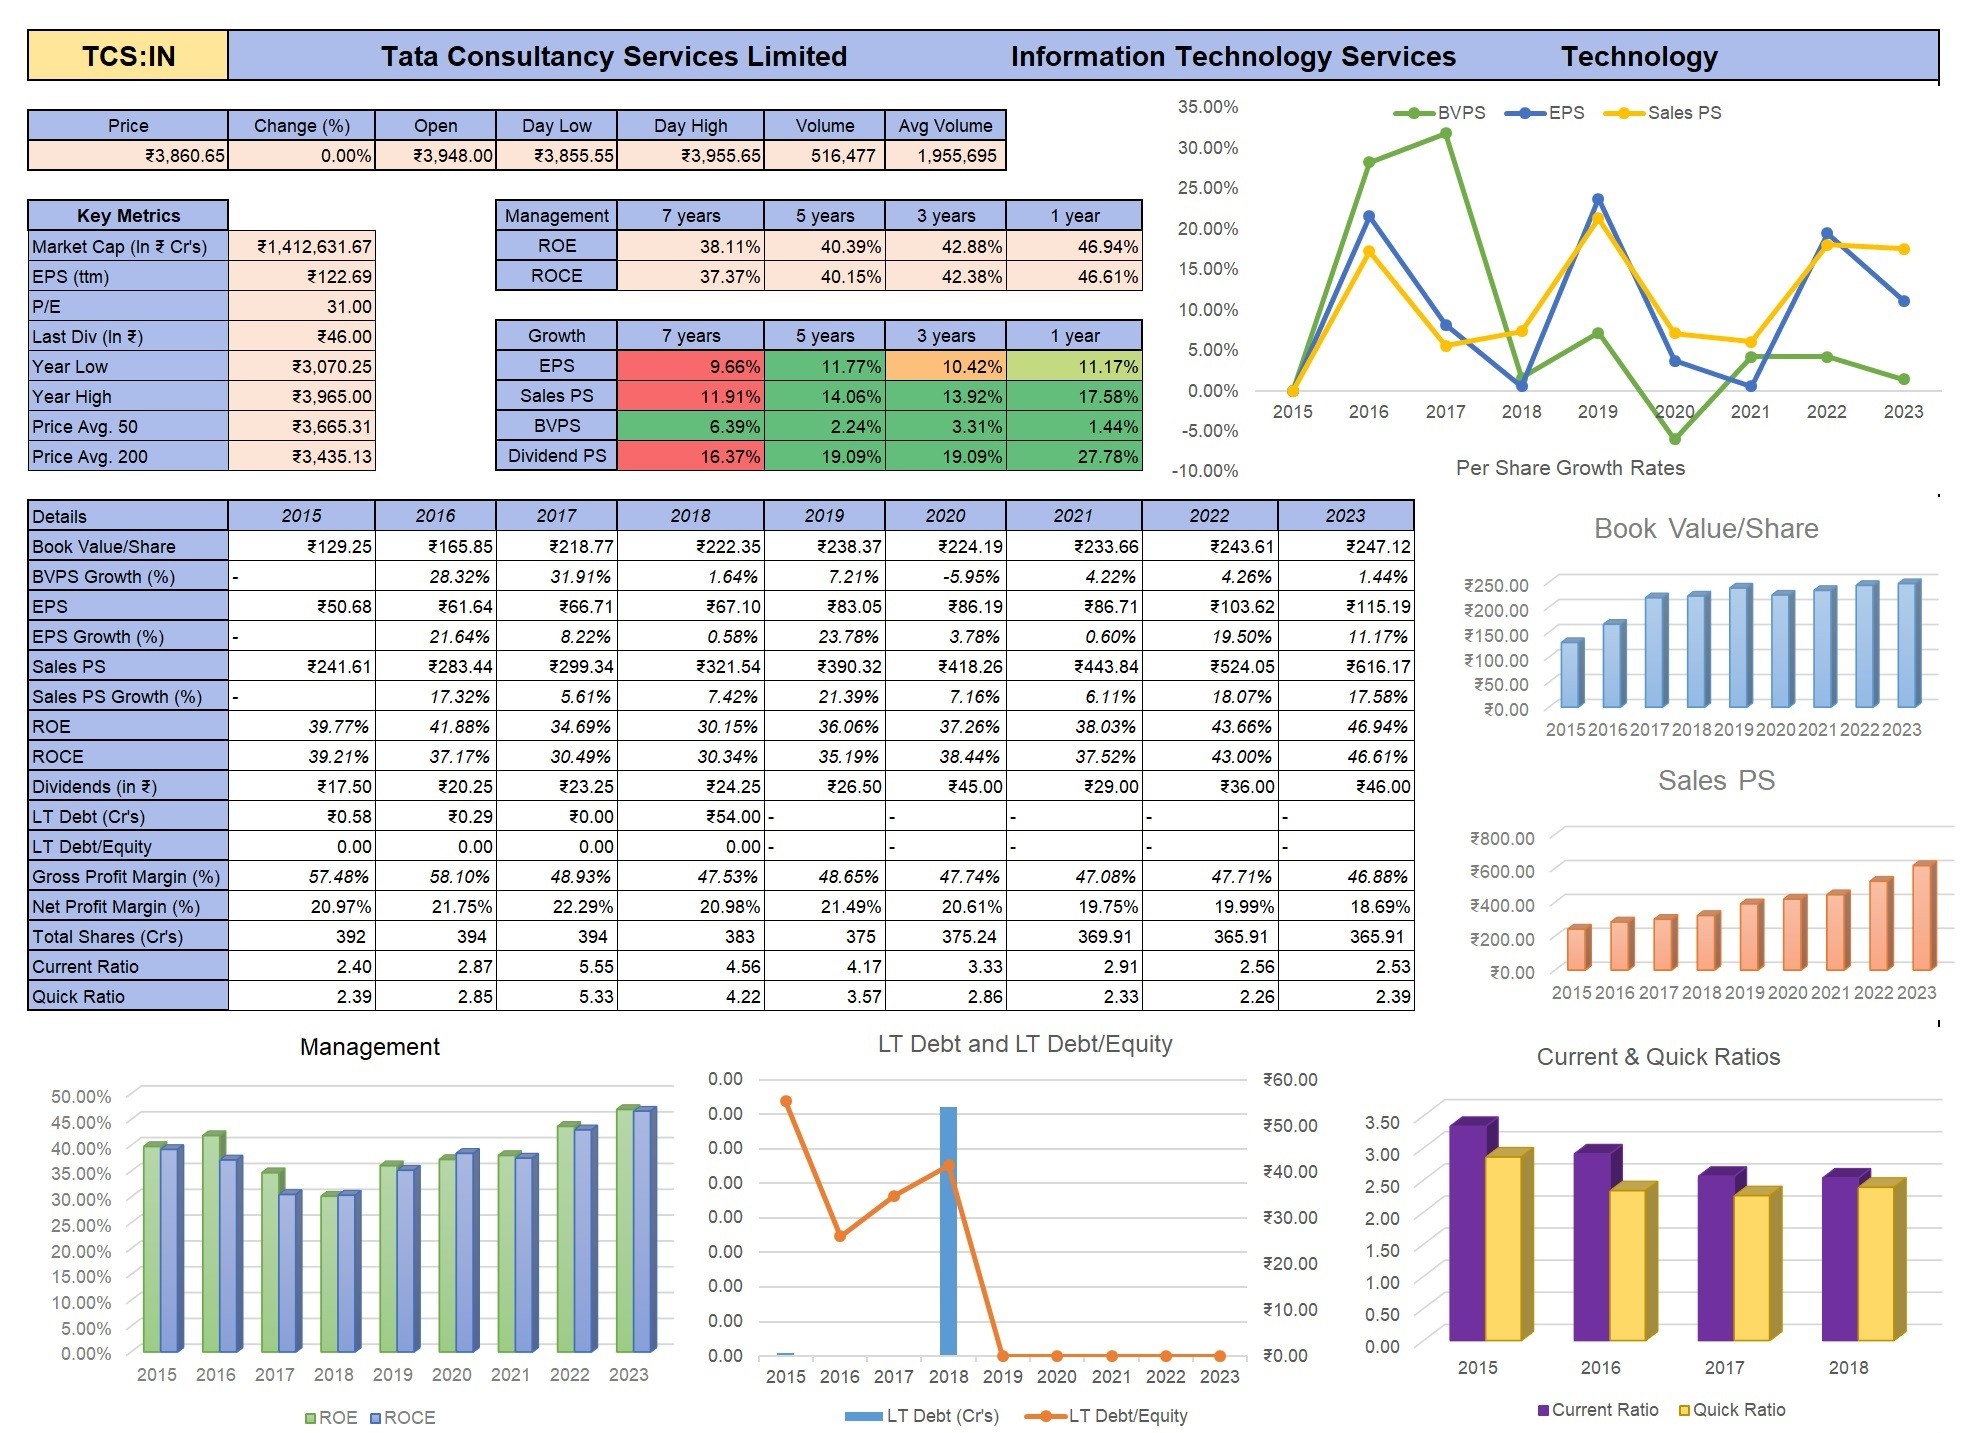
The Equity Research Dashboard Template is a tool that provides investors with in-depth and clear-cut analyses of Indian market stocks. This resource is designed to offer a multi-year financial review of public companies, with a particular focus on important performance indicators and emerging trends.
Key Features:
1. Performance Metrics Summary: Presents the annual financial data of corporations, including figures for sales, earnings, dividends, and earnings per share. Its ability to show historical data helps in tracking the performance trajectory of a company.
2. Valuation Ratios and Yield Metrics: Delivers metrics such as P/E ratio and ROE for a practical comparison of a stock's value relative to its earnings and the return yielded on equity.
3. Growth Indices: Provides growth percentages for dividends, sales, and EPS, enabling an evaluation of a company's financial expansion rate.
4. Financial Stability Indicators: Incorporates ratios like debt-to-equity for assessing a company's financial stability, and liquidity metrics such as current and quick ratios.
5. Graphical Illustrations of Trends: Uses charts to visually demonstrate a company's growth patterns, valuation trajectories, and key financial ratios for easy comprehension and interpretation.
Created by: Ankur

I invite you to book a demo with me or my team to save time, enhance your investment research, and streamline your workflows.
![Fundamental Data - Nifty Pharma Example [YT India Video 8.4]](https://marketxls-client.s3.us-east-2.amazonaws.com/1708797081080/cropped_image.png "Fundamental Data - Nifty Pharma Example [YT India Video 8.4]")