A major aspect of finance in the 21st century has been studying the market trends and then predicting the flow of market and trading upon underlying stocks. Options Trading is the phenomenon of trading on options contracts or securities of various stocks at a chosen price. People who delve into the world of trading and finance are made familiar with several parameters which ease the study of stocks and their comparison and help mask out one’s portfolio accurately. One such parameter is the Implied Volatility Rank of any underlying stock.
Implied volatility is the anticipated volatility of a market in the near future. Various parameters are used to predict volatility, the most significant ones being the strike price of an option and its expiry date. Normally, volatility can be calculated by simple statistical tools like standard deviation and Beta but the calculation of implied volatility requires advanced methods like the volatility surface. As an options trader, implied volatility not only shows how volatile the market might the but can also help to determine the likelihood of a stock reaching a specific price by a certain time. IV largely determines whether or not options are relatively cheap or expensive. Historically, this predicted volatility always overestimates actual volatility, and it’s this overestimation that can be exploited to the benefit to option sellers, providing that edge. The following article has been written to inform people about Implied Volatility Rank or IV Rank.
Implied Volatility Rank
Implied Volatility Rank is a measure of current implied volatility against the historical implied volatility range (IV low – IV high) over a one-year period. It adds a dimension of relativity to Implied Volatility and further helps options traders strengthen their portfolio and expand their options. Implied Volatility rank takes the highest and lowest levels of implied volatility over the trailing 52 weeks and ranks the current IV level relative to those highs and lows. a high IV rank means that a stock’s premiums are historically very high, creating a possible premium-selling opportunity. While a handy metric, IV rank can oversimplify things and make options trading look too accessible to some novices. Many might read the above paragraph and think, “wow, it’s as easy as selling when IV rank is high and buying when it’s low.” There is, of course, no magic bullet indicator, and IV rank is no different in this respect. Here’s the formula for one-year IV rank:
Implied Volatility Rank Example
Let’s have a look at the current AAPL Implied Volatility Rank and analyze it.
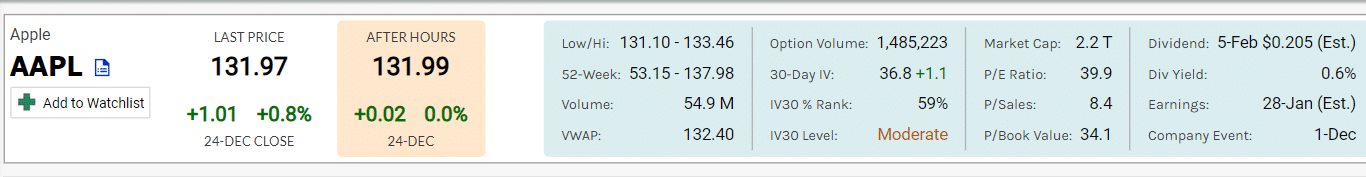
AAPL IV Percentile Rank
AAPL implied volatility (IV) is 36.8, which is in the 59% percentile rank. This means that 59% of the time the IV was lower in the last year than the current level. The current IV (36.8) is 10.2% above its 20 day moving average (33.4) indicating implied volatility is trending higher.
AAPL IV vs 20-Day HV
The current IV (36.8) in AAPL is 34.8% above its 20 day HV (27.3) suggesting that options markets are predicting future volatility to trade above the most recent 20 day realized volatility.
AAPL IV vs 252-Day HV Divergence
Traders frequently use the difference between implied volatility and historical volatility to measure divergence from the mean. Using the 252 HV as the long term benchmark, the implied volatility (36.8) is currently -15.7% below the 252 day HV (43.7) mean.
Disclaimer
None of the content published on marketxls.com constitutes a recommendation that any particular security, portfolio of securities, transaction, or investment strategy is suitable for any specific person.
The author is not offering any professional advice of any kind. The reader should consult a professional financial advisor to determine their suitability for any strategies discussed herein.
The article is written for helping users collect the required information from various sources deemed to be an authority in their content. The trademarks if any are the property of their owners and no representations are made
References
The above article on Implied Volatility Rank while descriptive, might not clear all your doubts. You can visit the following links to know more about Implied Volatility Rank.
- https://marketxls.com/implied-volatility-screener/
- https://www.warriortrading.com/implied-volatility-iv-rank/
- https://www.ino.com/blog/2019/04/implied-volatility-rank-key-to-successful-long-term-options-trading/#.X-lo8Ngza00
- https://www.projectoption.com/iv-rank-vs-iv-percentile/
- https://marketxls.com/difference-historical-implied-volatility/
- https://marketxls.com/implied-volatility-long-straddle/
- AAPL/IV/”>https://marketchameleon.com/Overview/AAPL/IV/
