Volatile Penny Stocks – How To Identify Them?

Meet The Ultimate Excel Solution for Investors
- Live Streaming Prices Prices in your Excel
- All historical (intraday) data in your Excel
- Real time option greeks and analytics in your Excel
- Leading data in Excel service for Investment Managers, RIAs, Asset Managers, Financial Analysts, and Individual Investors.
- Easy to use with formulas and pre-made sheets
Volatile Penny stocks are those stocks trading at a value of $5 or less than that, and its price is touching its highs and lows quickly and erratically.
In short, Volatile penny stocks are low-priced stocks that experience unusually rapid and significant price fluctuations.
Before diving deep, let us consider the various aspects related to volatile penny stocks:
• Why is volatility significant?
Volatility is significant to keep the market moving and to keep the prices fluctuating. The stock volatility can help us book our profits quickly but can also put us at risk of losing a large amount of money. We have to be safe from catching the top and bottom of price moves.
• What affects stock volatility?
Three things can affect stock volatility: the float (supply), volume (demand), and the stop losses.
The float is the total amount of shares of a company available to the public for trading. A low float means a limited supply. If there is a high demand for that stock, then it can result in a quick and erratic price rise due to high demand but not an equivalent supply to satisfy it. And on the other side, if there is low demand in case of a high float, then the stock price might drop suddenly due to high supply but not equivalent to high demand.
There is a general rule: The price of a stock must be backed by volume. Those stocks which are highly rated must have a high volume. If a stock price is very high, but it doesn’t have much volume traded, it might be overpriced, and the stock might see a sudden fall in price sooner or later. And on the flip side, if the price of a stock is low and its volume traded is comparatively high, then it might be under-priced, and the stock might see an erratic rise in price in the near future.
Stop losses are sell orders set at a particular price by traders to prevent their losses from being significant. Most traders put them at the same price level. This is where the problem occurs. When the stock hits that price, tons of stop losses get executed, and there might be a sudden fall in price.
• What are different categories of penny stocks?
o Tier 1: These stocks are under $5 per share but can also have a slightly higher price. They are listed on a major exchange and not on an OTC market.
o Tier 2: These are stocks that have a price of $0.01 to $1. They can be listed on a major exchange if they meet the minimum listing requirements.
o Tier 3: These are stocks below $0.01. They can be very volatile and hence profitable if traded in large quantities. But, they carry an equal amount of risk. Since they can not be listed on a major exchange, they are traded in an OTC market.
o Tier 4: Known as “hot penny stocks” or trip zero stocks are listings that must be priced with 3 0’s.
How can we identify volatile penny stocks using MarketXLS?
Step 1: Go to MarketXLS tab and click on the drop-down option of utilities under the utils section highlighted in yellow.

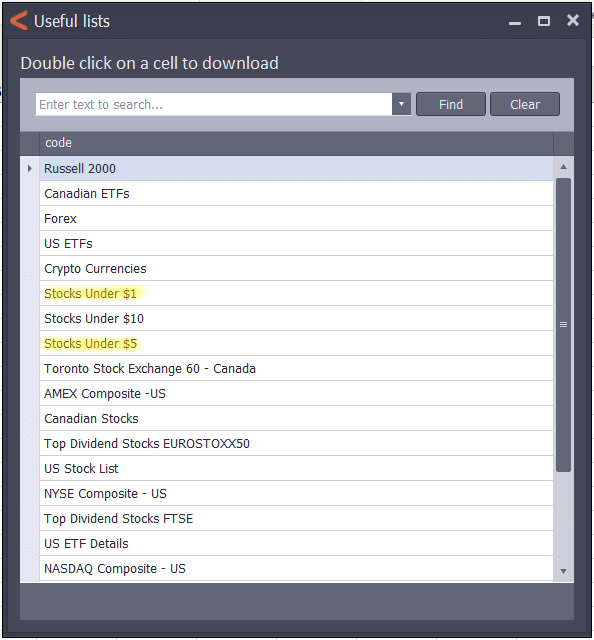
Step 2: From the drop-down list, click on “Useful lists.” A dialog box will appear. Double click on any category of penny stock list, i.e., “Stocks under $5” or “Stocks under $1,” to download that particular list. Let us consider the list – “Stocks under $5”.
Step 3: Now, you will see a list of all the stocks under $1.
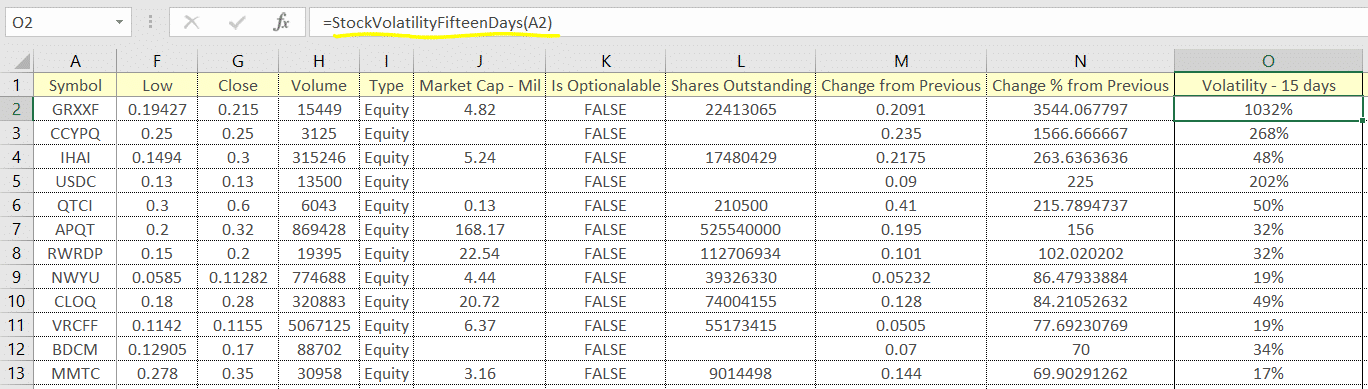
Now, the second concept which you need to consider is volatility. You can add a column heading that says “15 days Volatility”. MarketXLS provides functions for calculating volatility across various time periods. You can see this function in the formula bar. This will return the result of the stock volatility of that particular stock.
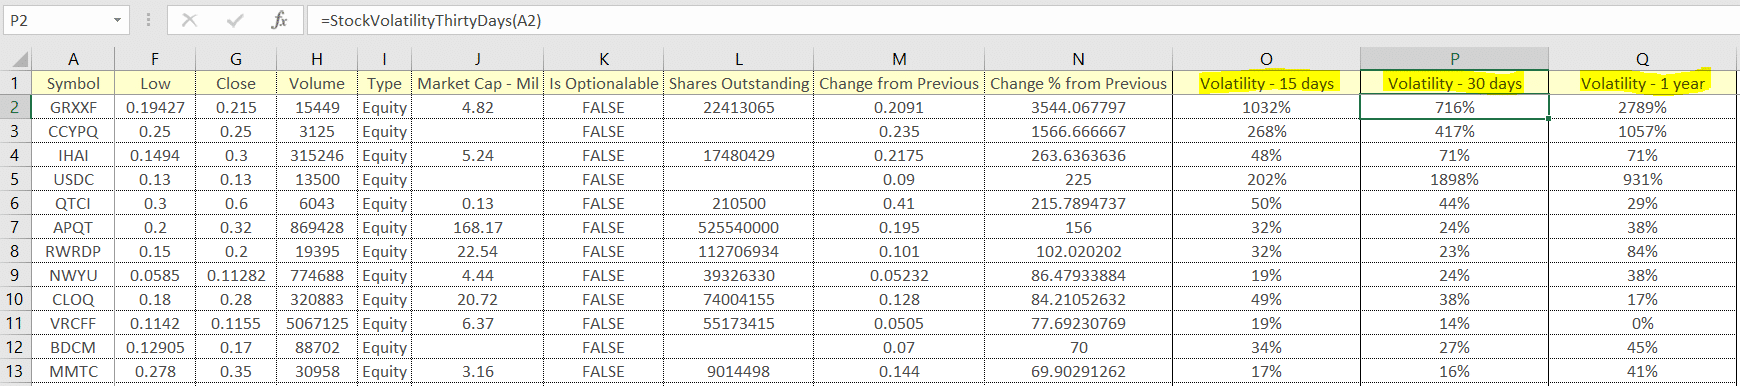
Similarly, you can add various columns for stock volatility. We have added three columns for the sake of this example. They are:
• Volatility – 15 days
• Volatility – 30 days
• Volatility – 1 year
Step 4: You have your list ready. Thanks to the software – MarketXLS! It excels in every work you assign. Now you can try your hands on and invest in the stocks according to your risk capacity.
Cessation
Thus, you can easily make a list of all those penny stocks currently trading at a highly volatile range using the MarketXLS Software. Volatile penny stocks come with a lot of risks, and hence you have to make your decisions wisely and smartly, keeping all the pros and cons in mind. You need to keep in mind two things while trading with these stocks: 1) When to book profits, 2) When to cut out losses. Timing is the most crucial factor while dealing with these stocks.
The pictures and graphics used were taken from this software itself – MarketXLS.
For more such useful information, please visit https://marketxls.com/.
Disclaimer
None of the content published on marketxls.com constitutes a recommendation that any particular security, portfolio of securities, transaction, or investment strategy is suitable for any specific person.
The author is not offering any professional advice of any kind. The reader should consult a professional financial advisor to determine their suitability for any strategies discussed herein.
The article is written to help users collect the required information from various sources deemed to be an authority in their content. The trademarks, if any, are the property of their owners, and no representations are made.
Reference
https://www.timothysykes.com/blog/high-volatility-penny-stocks/
https://www.benzinga.com/money/most-volatile-penny-stocks/

I invite you to book a demo with me or my team to save time, enhance your investment research, and streamline your workflows.