Implied Volatility Screener

Meet The Ultimate Excel Solution for Investors
- Live Streaming Prices Prices in your Excel
- All historical (intraday) data in your Excel
- Real time option greeks and analytics in your Excel
- Leading data in Excel service for Investment Managers, RIAs, Asset Managers, Financial Analysts, and Individual Investors.
- Easy to use with formulas and pre-made sheets
Implied volatility helps investors gauge future market volatility. It has a positive correlation with the expectation of stock price and is one of the six parameters used to determine the price of an option.
As an options trader, implied volatility is one of the most important factors to be kept in mind while trading. It not only shows how volatile the market might the but can also help to determine the likelihood of a stock reaching a specific price by a certain time.
In this post, I’ll be discussing how to find the options with maximum and minimum implied volatility using MarketXLS.
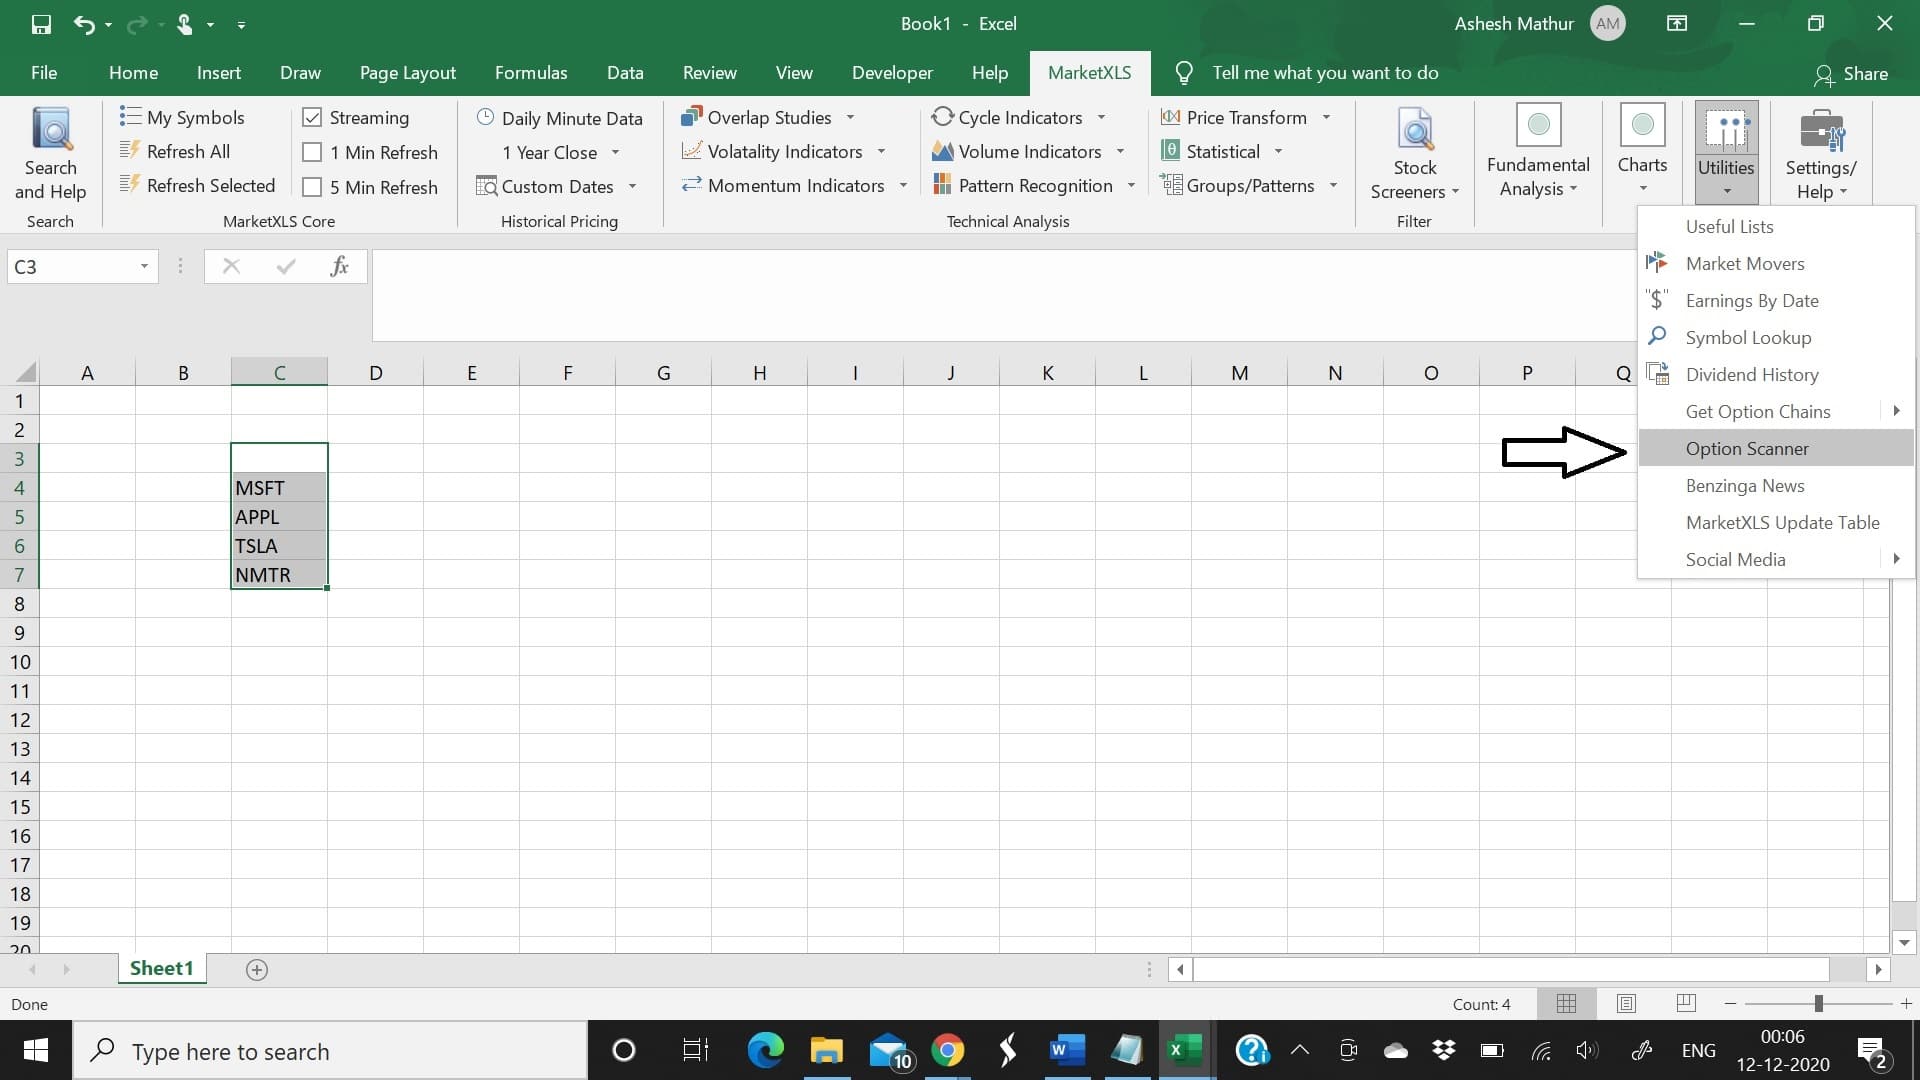
Step 1: Select stock symbols
Open a new excel worksheet and go to the MarketXLS tab. List down the symbols of stocks for which you want to trade options. You can select up to 40 tickers at one go. Then click on Utilities -> Option Scanner
Step 2: Filter Options
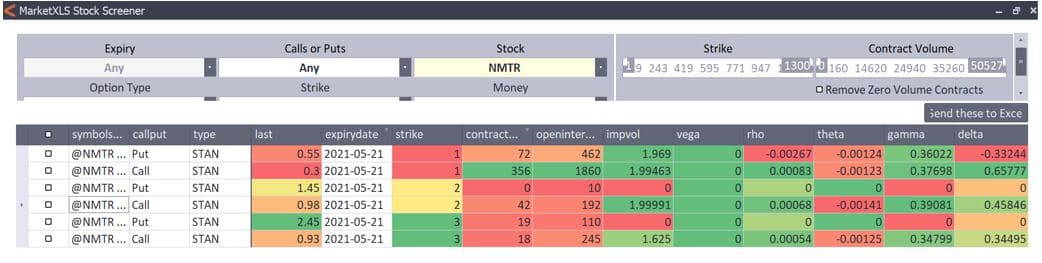
Marketxls Stock Screener window will pop up.
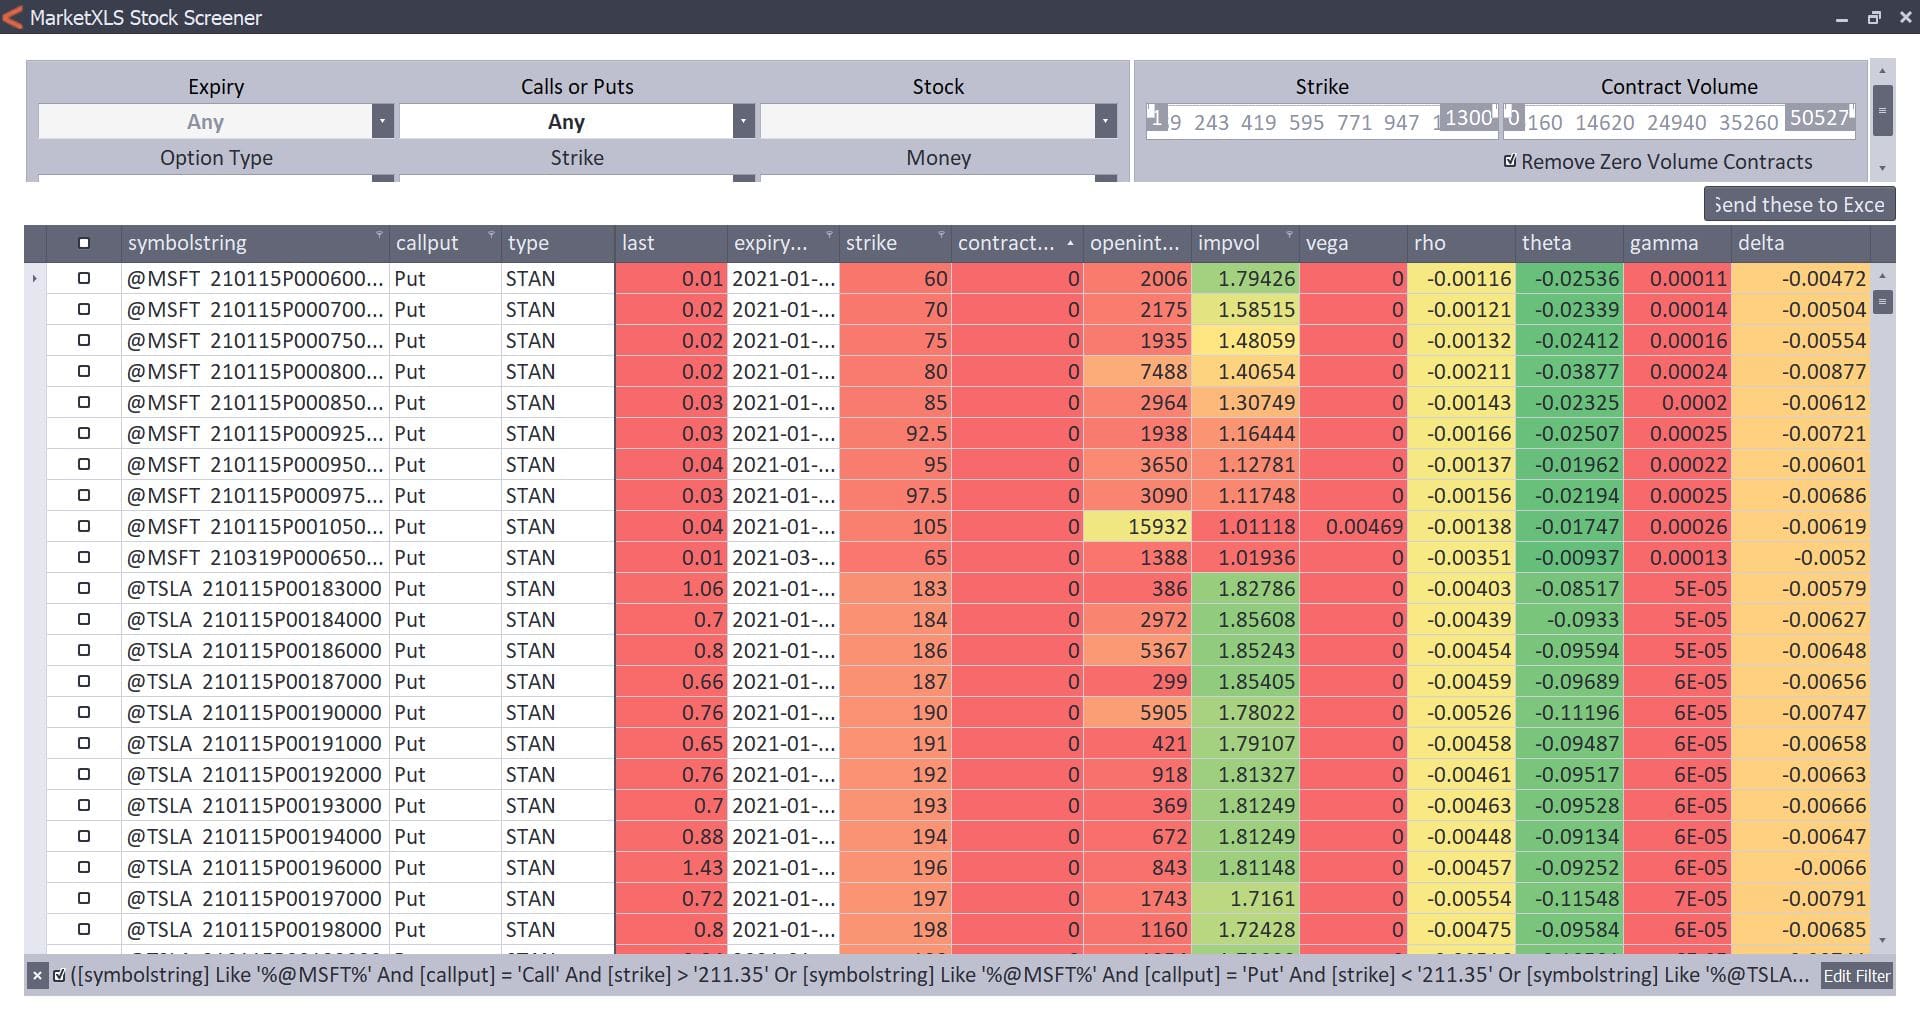
In this window, Options can be filtered by Volume, Moneyness, Expiration, Type, and Strike Price.
First of all, click on remove zero volume contracts to remove all options contracts with no volume.
Now, you can filter down the options as per your need –
• Expiration – include only options that expire from the dates selected from the dropdown.
• Calls or puts – Select from the dropdown if you want a call, put, or any.
• Stock – From all the stocks initially selected, you can filter out the stocks you would like to see from the dropdown.
• Option Type – Select if you want weekly, monthly, or any kind of option.
• Strike Range – Set the sliders to the minimum and maximum prices. Only options with a price between the minimum and maximum prices will be included on the screen.
You can also select the strike from the dropdown.
Nearest strike Above Last (1) – Selects option with strike price just above the current stock price
Nearest strike Above Last (2) – Selects option with strike price just above the current stock price
Nearest strike Below Last (1) – Selects option with strike price just below the current stock price
Nearest strike Below Last (1) – Selects option with strike price just below the current stock price
• Contract Volume – Only options with a daily volume between the minimum and maximum volume will be included on the screen.
• Moneyness – refers to the number of strikes an option is in or out of the money. From the dropdown, you can select in the money, out of the money, or any.
Step 3: Remove Unnecessary columns
Select the columns you wish to remove by simply drag and drop. I have removed vega for demonstration purposes.
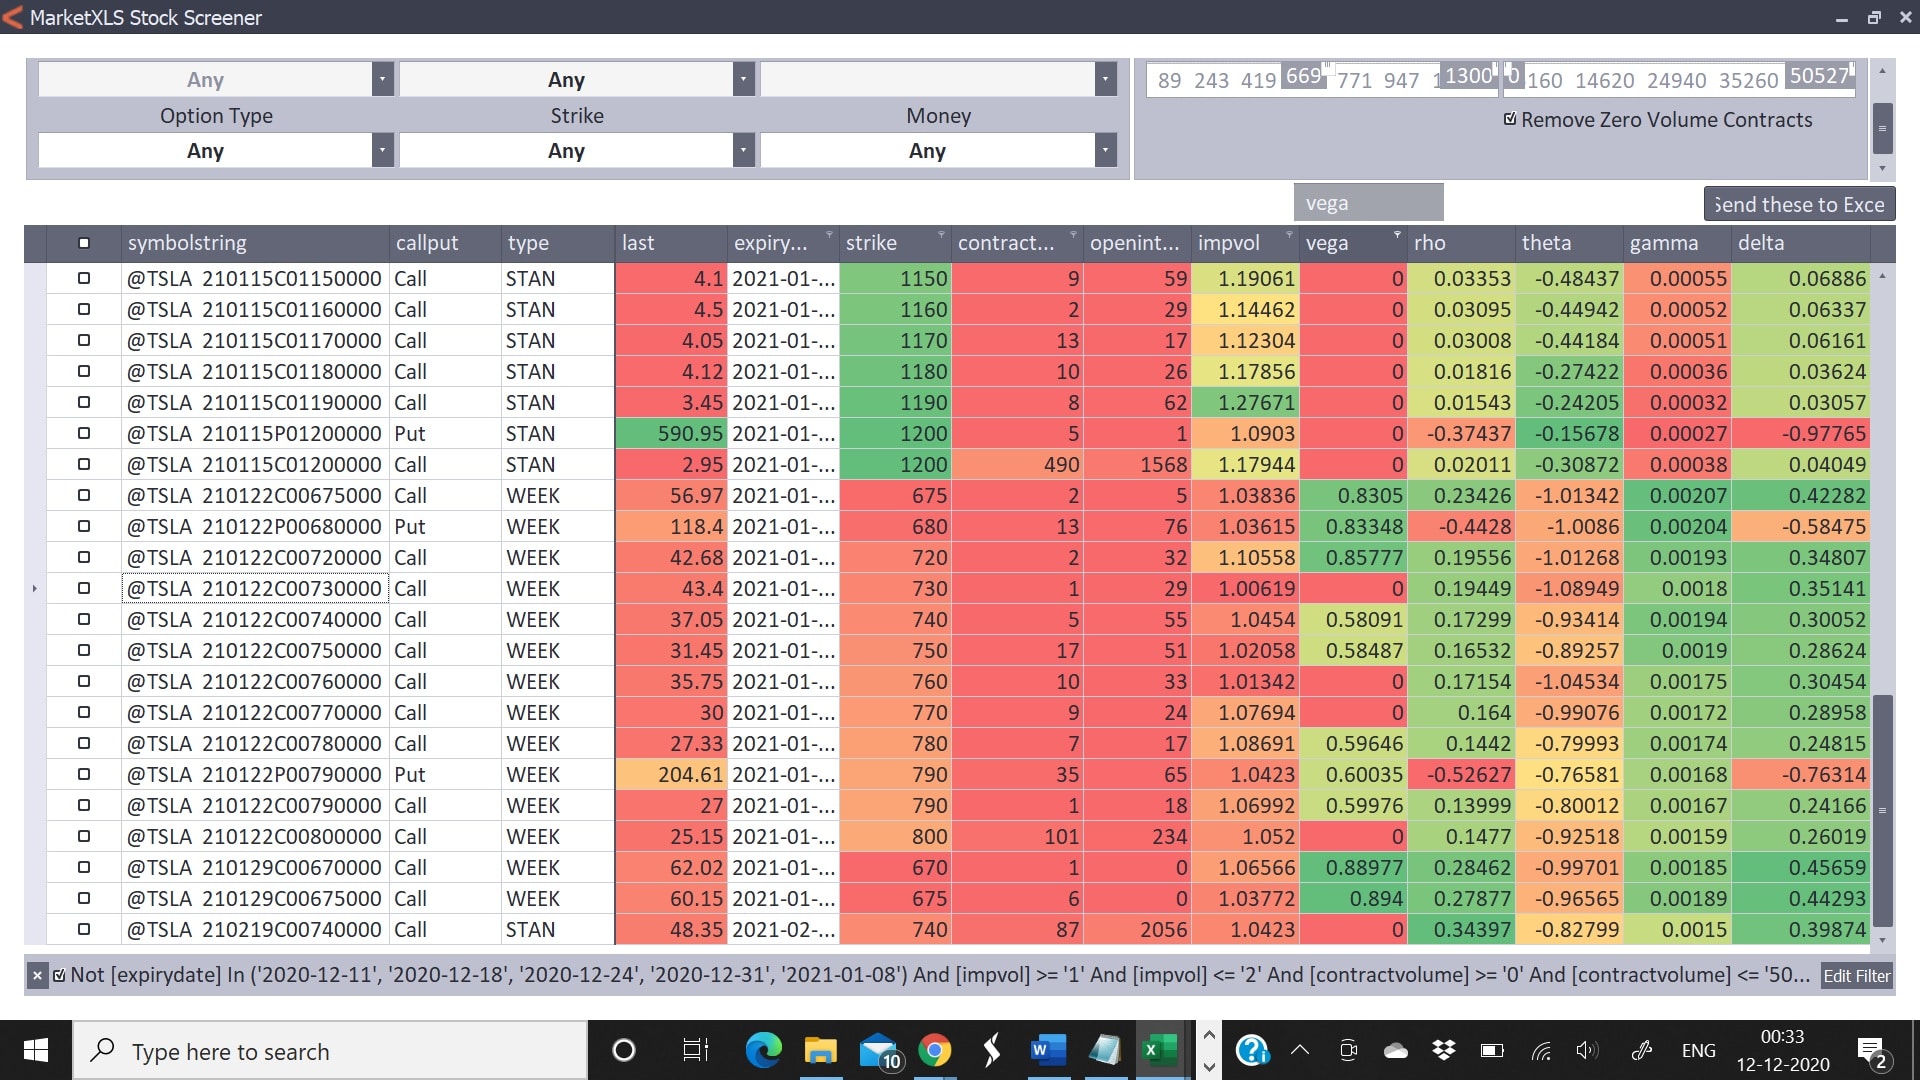
Step 4
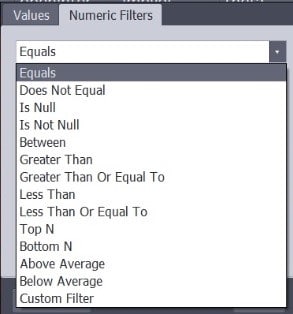
Click on any column header and select the range of values you wish.
You can also click on numeric filters to get a more specific search such as top N options with the highest implied volatility.
I have selected the top 6 options with the highest implied volatility of ‘NMTR’ expiring on 21 May 2020.
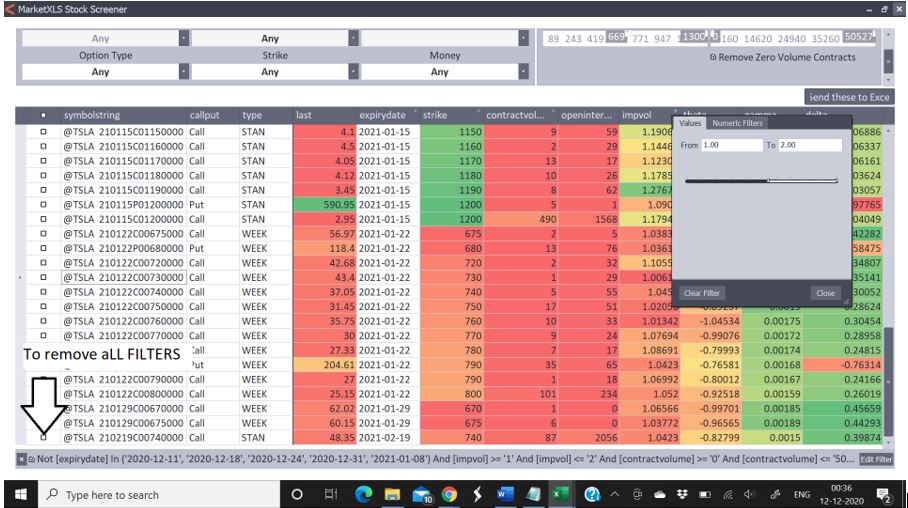
To remove all the filters, click on the bottom left cross mark.
Step 5: Export to Excels
Click on ‘Send these to Excel’ to get the filtered values in a new excel worksheet.
You will get all the data in a new worksheet with the name ‘Option Scanner Data’.
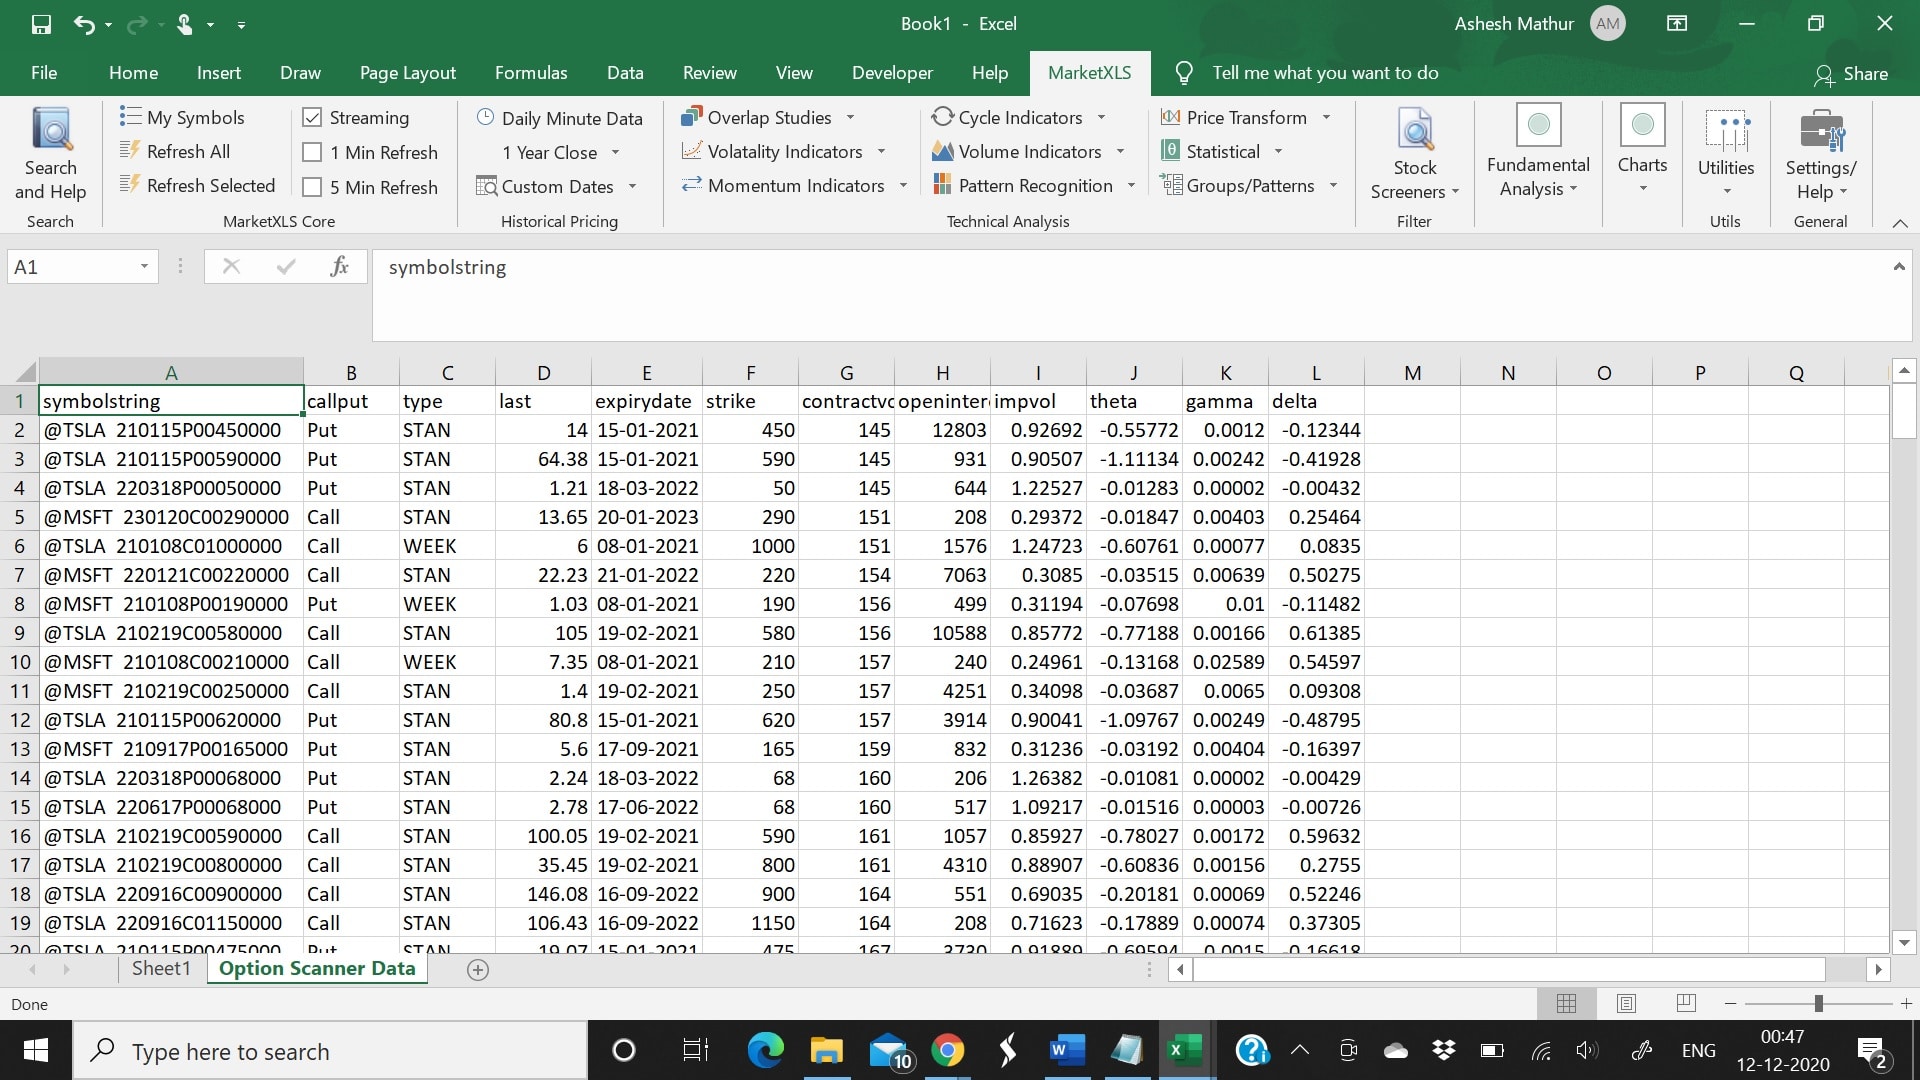
You can use the ‘qm_last’ function in a new column to get the latest options price.
MarketXLS lets you analyze all the options of over 40 stocks at a time. You get the freedom to filter the options on all important factors. It becomes easier to eliminate options that are not meeting your requirements and give emphasis on those options that are well inside your defined metrics.
Disclaimer
None of the content published on marketxls.com constitutes a recommendation that any particular security, portfolio of securities, transaction, or investment strategy is suitable for any specific person. The author is not offering any professional advice of any kind. The reader should consult a professional financial advisor to determine their suitability for any strategies discussed herein.
References
For further reading on implied volatility click here.
Get Market data in Excel easy to use formulas
- Real-time Live Streaming Option Prices & Greeks in your Excel
- Historical (intraday) Options data in your Excel
- All US Stocks and Index options are included
- Real-time Option Order Flow
- Real-time prices and data on underlying stocks and indices
- Works on Windows, MAC or even online
- Implement MarketXLS formulas in your Excel sheets and make them come alive
- Save hours of time, streamline your option trading workflows
- Easy to use with formulas and pre-made templates

I invite you to book a demo with me or my team to save time, enhance your investment research, and streamline your workflows.