
I have $10,000 and would like to buy some stock but everything seems kind of overpriced to me. I hate paying too much for stock; but on the other hand, I hate for my money to sit around doing nothing. It needs to be out there working for me.
When this situation comes around, selling cash-secured puts can help. Market XLS can help me evaluate the option chain so I can sell the put that is best suited to my situation.
An example will illustrate this best.
I wouldn’t mind owning some Walmart (WMT) stock. Today’s price is $97.73, so I could just buy 100 shares outright and that would use up my $10,000. But I would rather pay a little less for it….below $95 if possible.
When you sell a cash-secured put, you establish a price (the strike price) at which you are willing to buy the stock, and a date for this transaction to occur (the option expiration date), and then someone else pays you money (the option premium) to obligate you to buy those shares, but ONLY IF the share price drops below the strike price on the expiration date. One option contract is an obligation to buy 100 shares of stock (if below the strike price).
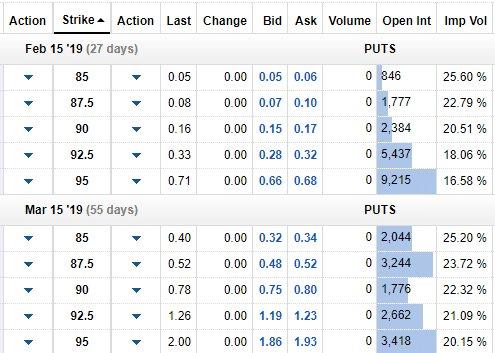
The table below is from the Fidelity website and shows just a few of the put options available for WMT. I filtered it to show only 2 expiration dates, and strike prices between $85 and $95…just to keep things fairly simple.
Looking at the very last row, I see that someone is willing to pay me the bid price of $1.86 per share (x 100 shares is $186.00) to obligate me to buy 100 shares of WMT at $95 per share on 3/15/19, if the stock price that day is less than $95.00
If I sell this put, I will receive $186 (less a $5 fee to Fidelity) right away and I can spend it today or do whatever I want to with it. I also need to keep $9500 in cash in my Fidelity account so that I can buy the stock if it comes to that. This is what makes it a cash-secured put.
There are 2 possible scenarios for what comes next……….
Scenario 1: The share price is greater than or equal to $95 on 3/15/19. In this case I keep the $186 option premium I’ve already received, and the $9500 that I put aside is freed up. I can sell another put, or spend the money however I choose now that I am no longer obligated to anything.
Scenario 2: The share price is less than $95 on 3/15/19. In this case, the shares are assigned to me. The $9500 I set aside is used to buy 100 shares of WMT at $95 per share, a price that I was willing to pay.
option pricing in excel
So far so good, but I would like a good way to evaluate the various rows on the option chain.
How do I compare them when the length of time might be 27 days or 55 days?
How do I compare $186 for setting aside $9500 for 55 days with $119 for setting aside $9250 for 55 days. With this, there is also an increased probability the shares will be assigned if I choose the $95 strike price compared to the $92.50 strike price…just because there isn’t as far for the price to drop.
This is where MarketXLS and a little bit of Excel knowledge can help.
MarketXLS has a wonderful utility which allows you to import ALL available options for a given stock. And get live option prices in Excel.
Here are the steps I use to import the data to make the best data-driven decision.Open a new Excel spreadsheet and type in the ticker for the stock I am interested in.With the ticker cell selected, click on MarketXLS, Utilities, then Option Chain.All of the available Call and Put options will populate a separate tab on the spreadsheet.
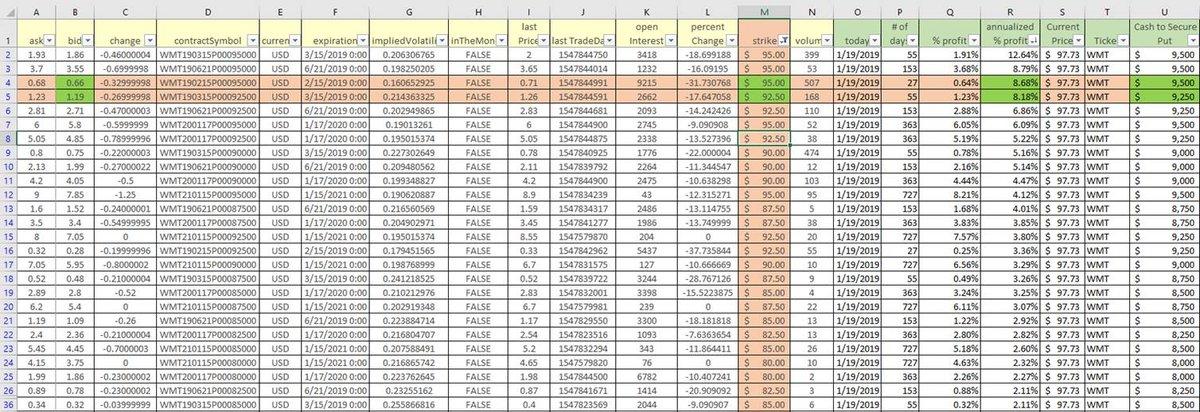
Since I’m only interested in Puts, it will help to get rid of the Calls. Contract symbols with a “C” in the center of the name are Calls. I can filter on the contract symbol column to show only the ones containing “C” and then delete those, and clear the filter. Only the Puts will remain, as shown below.
Next I will add 7 columns (O-U on image below).
- Today’s date. The Excel formula for this is “= today()”2) # of days between today and the expiration date. The formula on row 2 is “f2-o2”3) % profit. This is the calculated by taking the bid price and dividing it by the strike price. Row 2 shows a bid price of $1.86 and a strike price of $95. $1.86 divided by $95 is the % profit, in this case 1.96%. Since Fidelity charges a fee of around $5 for this transaction, I deduct that to show the profit after fees. For row 2 this formula is “(b2-0.05)/m2” and the result is a 1.91% profit.4) Annualized % profit. The purpose of annualizing the profit is to allow for comparison with other rows. The formula in row 2 is “(q2*365)/p2”. In this case the annualized profit is 12.64%. This means that if I could make the same transaction every 55 days for a year, I would earn 12.64% profit on the $9500 I’ve set aside, assuming that the shares were never assigned.5) Current Price is grabbed by MarketXLS using the formula “=last(t2)”6) Ticker is added for MarketXLS to be able to grab the current price.7) Cash to Secure Put. This is simply the strike price x 100, and is the amount that must be set aside.
I then sort by column R, showing the rows with the highest annualized % profit on top.
Continuing to think about row 2…….1.91% is nothing to get too excited about, but keep in mind that is the yield on your cash over a 55-day period. The 12.64% annualized yield is pretty darned good for holding cash. Not sure where else you could get such a yield on your cash.But also consider that today’s price is $97.73 and the strike price is $95. If the share price falls below $95 in the next 55 days, then I will be buying the stock. Given recent market volatility this seems like a possibility. It would be OK but I might rather look at the $92.50 strike price, or look at a shorter time frame to decrease the probability of the shares being assigned to me.
Rows 4 and 5, for me, find the sweet spot.* Row 4 keeps the $95 strike, but I only have to wait 27 days for the outcome, and that is less time for the price to fall. This pays an annualized 8.68% which is acceptable to me.* Row 5 keeps the 55 day expiration, but reduces the strike price to $92.50. This means the price could fall a little further without the shares being assigned. This option pays an annualized 8.18%, also acceptable.
I hope this has illustrated some of the decisions to be made when selling cash-secured puts, and how MarketXLS can help.Note that my calculations have used the bid price because I know for a fact that someone is willing to pay me that amount. You can, however, try to sell for a price between the bid and ask, and increase your profit just a bit.
call & put options
For those who do not have much experience trading options, I’d like to list some of the risks.
1. If you sell the option with the $95 strike and the price drops to $60 per share, you are still obligated to buy 100 shares at $95 each. This is the biggest risk and is why it is important to sell these option contracts only if you want to own the shares and would be willing to pay the strike price for them.2. The further out the expiration date, the more time there is for crazy / undesirable things to happen. Personally, I like to keep expiration dates less than 60 days most of the time.3. If this is a dividend stock and there is an ex-div date during the option contract period, you will not receive the dividend since you did not own the stock on the ex-div date.4. If you are selling the options in a regular (taxable) brokerage account, be aware that the premiums are taxed as short term capital gains. If the shares are assigned, the premium is, instead, used to reduce your cost basis and thereby increase your capital gains when you later sell.
Good luck!
** Note from MarketXLS. This article is kindly contributed by longtime MarketXLS user. The functionality shown in this article is for representation only and may be different in a different version of MarketXLS. If you have any message for the Author please contact us **
Download MarketXLS Option Templates
Like what you see?
Click Below to See Our Full Video with Option scanner, option functions and this template.
