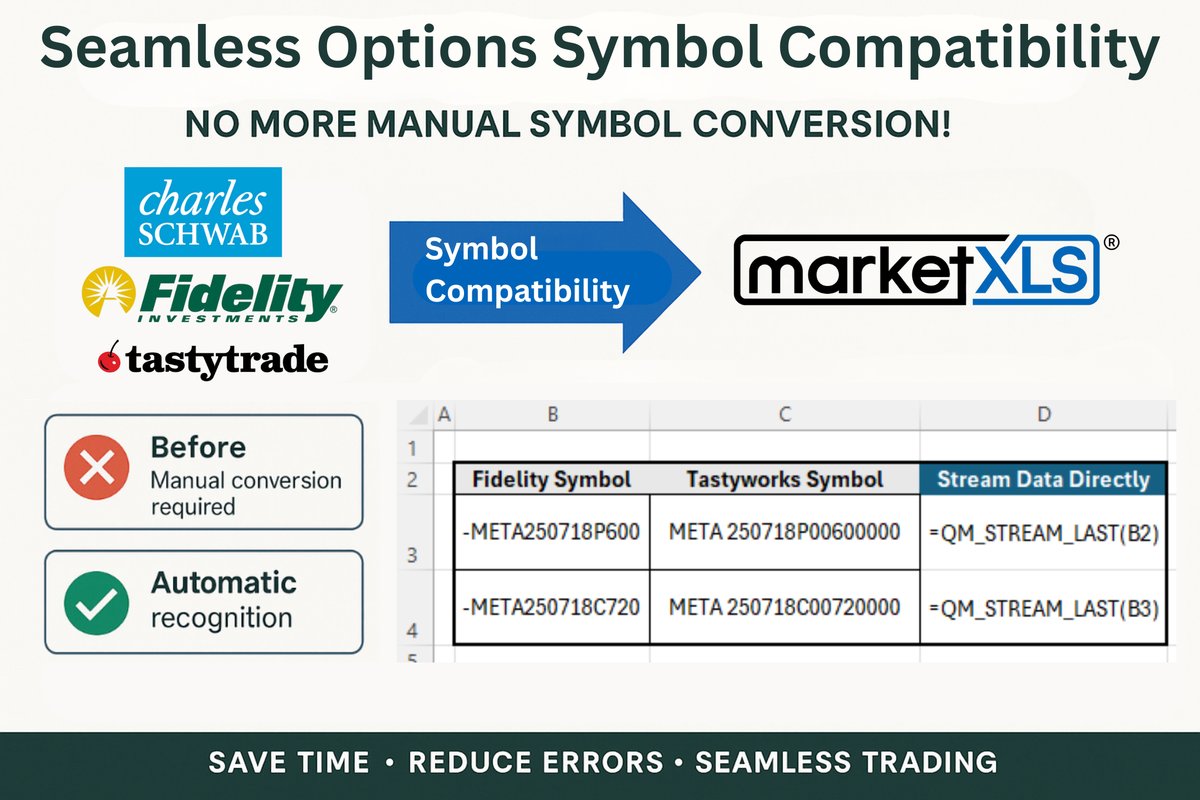
Release Date: August 12th, 2025We are excited to announce the release of MarketXLS version 9.4.0. This update brings significant improvements to symbol compatibility, performance enhancements, and...
Product Updates & Announcements
Expert insights on stock market analysis, investment strategies, and Excel techniques for smarter investing.
For long-term investors, the past decade has been a masterclass in the power of innovation, growth, and sticking to a strategy.
Release Date: August 12th, 2025We are excited to announce the release of MarketXLS version 9.4.0. This update brings significant improvements to symbol compatibility, performance enhancements, and...
MarketXLS has added a new set of functions for analyst and earnings data. This guide provides an overview of each function and its usage. Analyst Coverage Functions These functions provide data on the number of analysts covering a stock. Example: =AnalystConsensus(AAPL) returns the number of analysts whose estimates are included in the consensus figures for */ -->
--- Introduction For traders and analysts who rely on up-to-the-second information, accessinglive futures prices in Excelis a critical component of a robust market analysis toolkit.
Managing risk is as critical as managing returns. Learn how to hedge a portfolio with ETFs using strategic asset allocation and tactical hedging instruments—with quantifiable, data-driven methods.
Spot Bitcoin ETFs launched in 2024, unlocking institutional access to cryptocurrency. Learn which bitcoin ETF is best by tracking fund flows, fees, and liquidity using data-driven analysis in Excel.
Gold ETFs provide hedging against inflation and volatility. Learn how to invest in gold ETFs, compare physically-backed vs. mining funds, and find the best gold ETF using data-driven analysis.
Beyond passive index funds lie specialized ETFs: leveraged, inverse, and covered call funds. Learn what these advanced strategies are, their critical risks, and how to analyze them with MarketXLS.
Bond ETFs are the bedrock of portfolio diversification, but they're not simple bonds. Learn what a bond ETF is, how does a bond ETF work, and how are bond ETF dividends taxed using professional analysis.
Performance is only half the story—risk is the other half. Learn how to measure ETF risk alpha, ETF risk beta, and ETF risk Sharpe ratio using quantifiable metrics in Excel with MarketXLS.
Learn how to build an ETF portfolio that's truly diversified. Discover how to identify and eliminate hidden overlap in your holdings using professional-grade analysis tools and MarketXLS functions.
Cost is one variable you can control in asset management. Learn what an ETF expense ratio is, how ETF fees work, and how to determine if a fund's costs are justified using data-driven analysis in Excel.
The ETF vs. Mutual Fund debate isn't about which is better—it's about which is the right tool. Learn how to conduct data-driven comparisons in Excel using MarketXLS to analyze cost, performance, and risk.
For investment professionals, understanding what an ETF fund is means having a methodology to deconstruct any fund, quantify its components, and determine portfolio suitability using Excel.
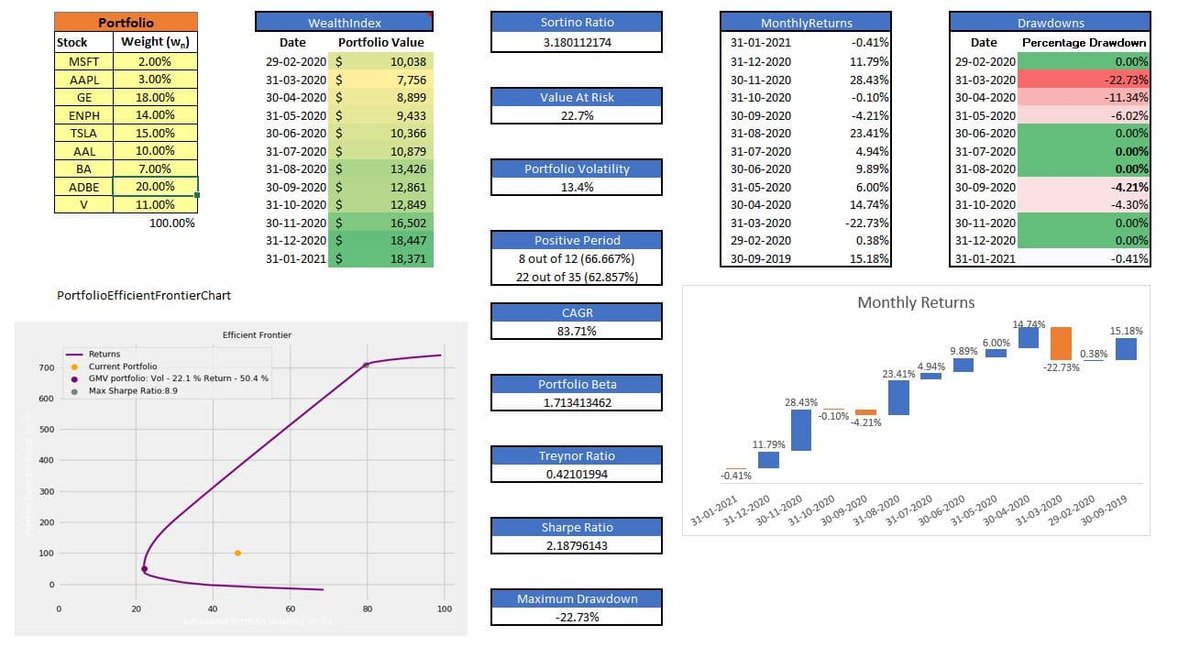
Master advanced portfolio optimization techniques including the Black-Litterman model, AI-driven portfolio construction, and institutional-grade optimization methods for complex portfolios.
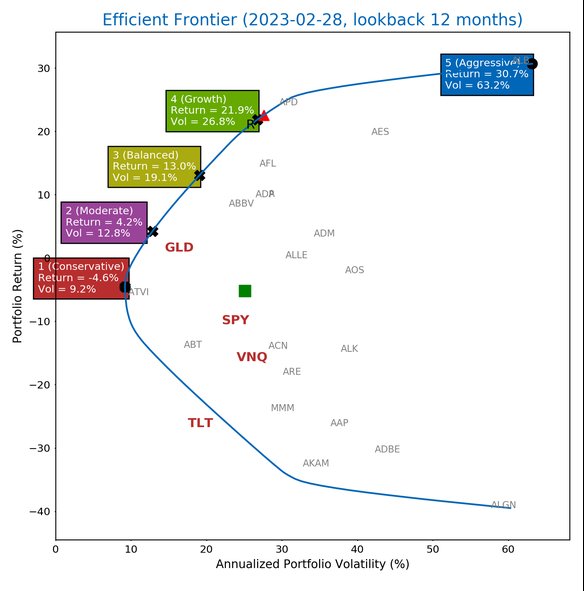
Learn how to implement sophisticated portfolio optimization in Excel using MarketXLS functions. Build efficient frontiers, calculate risk metrics, and create professional portfolio analytics dashboards.