

How to build a trading journal in Excel: the fields to log, the formulas for win rate, profit factor, and expectancy, and how MarketXLS fills prices and context automatically.
Excel & Tools
Expert insights on stock market analysis, investment strategies, and Excel techniques for smarter investing.
Browse articles by topic, arranged in reading order.
How to build a trading journal in Excel: the fields to log, the formulas for win rate, profit factor, and expectancy, and how MarketXLS fills prices and context automatically.

Refinitiv Eikon (now LSEG Workspace) vs MarketXLS for Excel: data coverage, formulas, pricing, and which fits institutional desks versus individual investors and RIAs.

Portfolio Sharpe Ratio = (return minus risk-free rate) / standard deviation. How to calculate and annualize it in Excel, interpret it, and compare it with Sortino and Treynor.

Value at Risk (VaR) estimates the loss a portfolio should not exceed at a set confidence level. Calculate parametric, historical, and Monte Carlo VaR in Excel.

The options wheel strategy explained: sell cash-secured puts, then covered calls, and track premiums, cost basis, and returns in an Excel workbook with MarketXLS.

0DTE Options Strategy — a complete guide to zero-day expiration trading on SPX, SPY, QQQ, and individual stocks. Strategies, risk management, and real-time Excel analysis for same-day options.

Build an SPX options screener in Excel: pull the chain with =QM_GetOptionChain("^SPX"), add Greeks, filter by expiration, moneyness, delta, and volume, then rank setups.

Build a credit spread calculator in Excel: net credit, max profit, max loss and breakeven for put and call credit spreads, plus a strike screen with MarketXLS option data.

How to build an SPX iron condor in Excel: max profit, max loss, breakevens, and return on risk formulas, a worked example, and entry, adjustment, and exit rules.

Build a covered call calculator in Excel: premium, static and annualized ROI, breakeven, and max profit, with option prices pulled by MarketXLS formulas.

0DTE SPY options expire at 4:00 PM ET the day they trade. Five strategies with worked numbers, 1-2% position sizing, exit rules, and an Excel monitoring setup.

SPX vs SPY Options — understand the critical differences in settlement, exercise style, tax treatment, and contract size to choose the right S&P 500 options for your trading strategy.

A comparison of 8 Excel add-ins for stock data in 2026: real-time prices, options chains, fundamentals, Mac support, and who each one fits.

Build an options profit calculator in Excel: pull premiums and Greeks with MarketXLS, then compute max profit, max loss, and breakeven for covered calls, spreads, and iron condors.

Build a self-updating dividend tracker in Excel: formulas for yield, dividend per share, payment frequency, and projected annual income, compared with manual and Google Sheets methods.
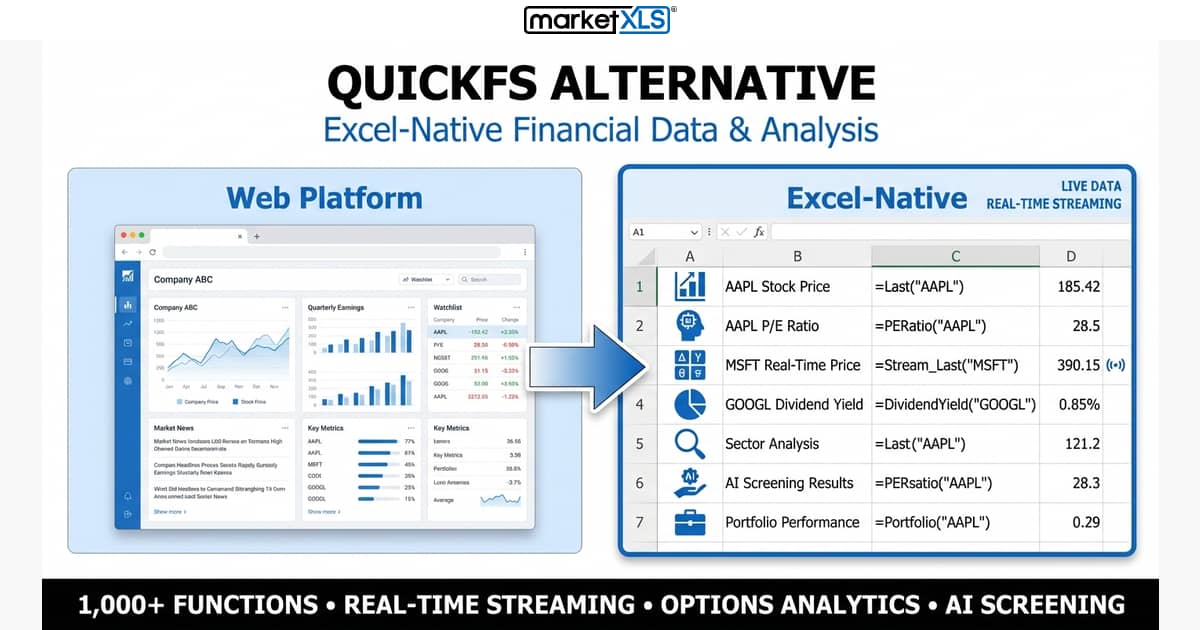
MarketXLS as a QuickFS alternative: financial statement formulas in Excel plus prices, options, and indicators. Where each tool is stronger, and how to map formulas.
Live market data, stock screening, options analytics and portfolio management inside Excel.