

Credit spread calculator Excel — calculate max profit, max loss, breakeven, and return on risk for bull put and bear call spreads with scenario analysis, position sizing, and live MarketXLS formulas.
Options Trading
Expert insights on stock market analysis, investment strategies, and Excel techniques for smarter investing.
Browse articles by topic, arranged in reading order.
Credit spread calculator Excel — calculate max profit, max loss, breakeven, and return on risk for bull put and bear call spreads with scenario analysis, position sizing, and live MarketXLS formulas.

Free quarterly earnings tracker for Excel: compare P/E, RSI, and trend, model EPS beat/miss scenarios, and size positions with MarketXLS formulas.

How to compare two mutual funds side by side: costs, holdings overlap, returns, risk, and tax efficiency, using the free FundXLS mutual fund and ETF comparison tools.
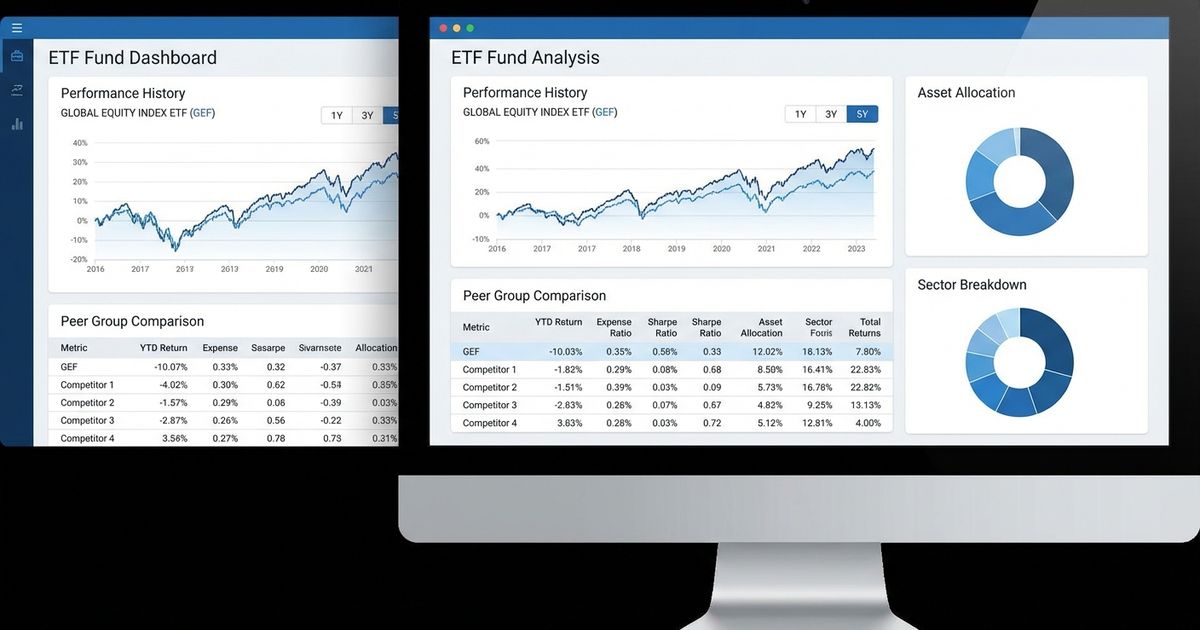
Build an ETF portfolio in four steps: set your stock/bond allocation, pick one low-cost ETF per bucket, check overlap and risk, then rebalance on a schedule or 5% drift.

Best value ETF options ranked by proprietary value scores, historical performance, expense ratios, and holdings quality — covering large-cap, mid-cap, small-cap, and international value funds for every portfolio strategy.

How to compare ETFs side by side: holdings overlap, expense ratio, performance, sector exposure, and risk, with free FundXLS tools to check each one.

An ETF screener filters thousands of exchange-traded funds by expense ratio, asset class, sector, holdings, performance, and size. How to use the FundXLS ETF screener.

How to get an option price in Excel: OptionSymbol plus QM_Last for one contract, QM_GetOptionQuotesAndGreeks for a full chain, and Black-Scholes for theoretical value.

How to connect Claude to the MarketXLS MCP server to fetch stock prices, options chains and financial statements in a conversation, with setup steps and plan requirements.

How to build a stock portfolio tracker in Excel: holdings table, live prices with MarketXLS formulas, P&L, dividends, sector allocation, benchmark and risk.

MarketXLS launches its Model Context Protocol (MCP) integration, connecting over 1,000 analytical Excel functions to leading AI assistants including Claude, ChatGPT, Cursor, and Windsurf.
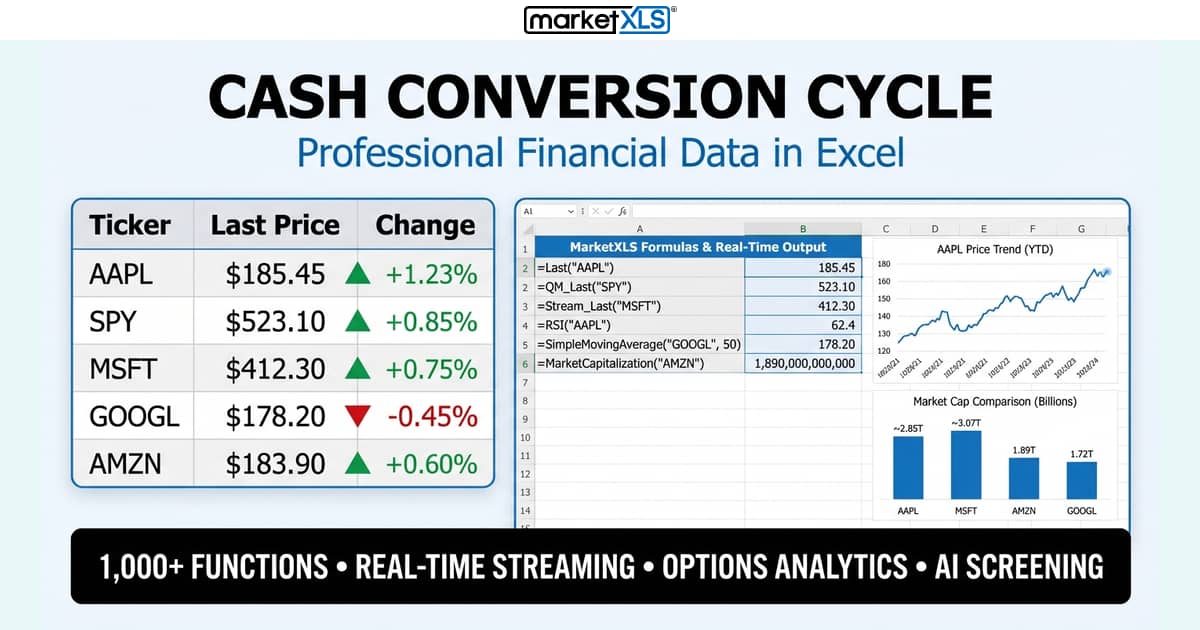
The cash conversion cycle (CCC = DIO + DSO - DPO) is the number of days between paying suppliers and collecting from customers. Formula, worked example, benchmarks, and Excel setup.

Find dividend yield in Google Sheets or Excel with =DividendYield("AAPL"), calculate it by hand, and screen for high-yield stocks while avoiding yield traps.
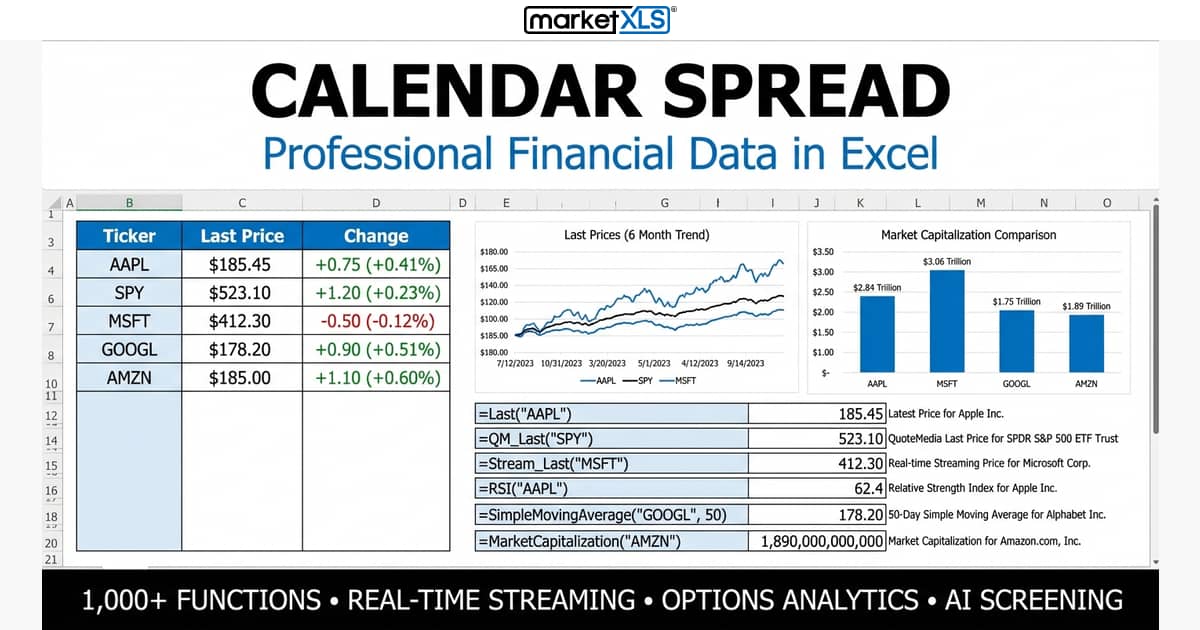
A long put calendar spread sells a near-term put and buys a longer-dated put at the same strike to profit from faster time decay. Setup, Greeks, management, and Excel tracking.

How to identify, screen, and analyze volatile penny stocks in Excel with MarketXLS: volatility metrics, screening criteria, and risk management.

Earnings Power Value (EPV) = normalized after-tax earnings / WACC, a no-growth intrinsic value. The full formula, a worked example, and an Excel spreadsheet using MarketXLS.
Live market data, stock screening, options analytics and portfolio management inside Excel.