Calculating Expected Stock Movement with MarketXLS: A Comprehensive Guide
Basic Stock Information
- Current Stock Price:
Last(ticker)Returns the latest price for the specified stock ticker - Example: For MSFT at $422.37
- ATM Strike Price:
StrikeNext(ticker, 0)Identifies the nearest strike price - Example: For MSFT, strike of $422.50
- Expiration Date:
ExpirationNext(ticker, 0)Determines the next option expiration date - Time to Expiration:
ExpirationDate - TODAY()
Option Symbol Generation
- Call Option:
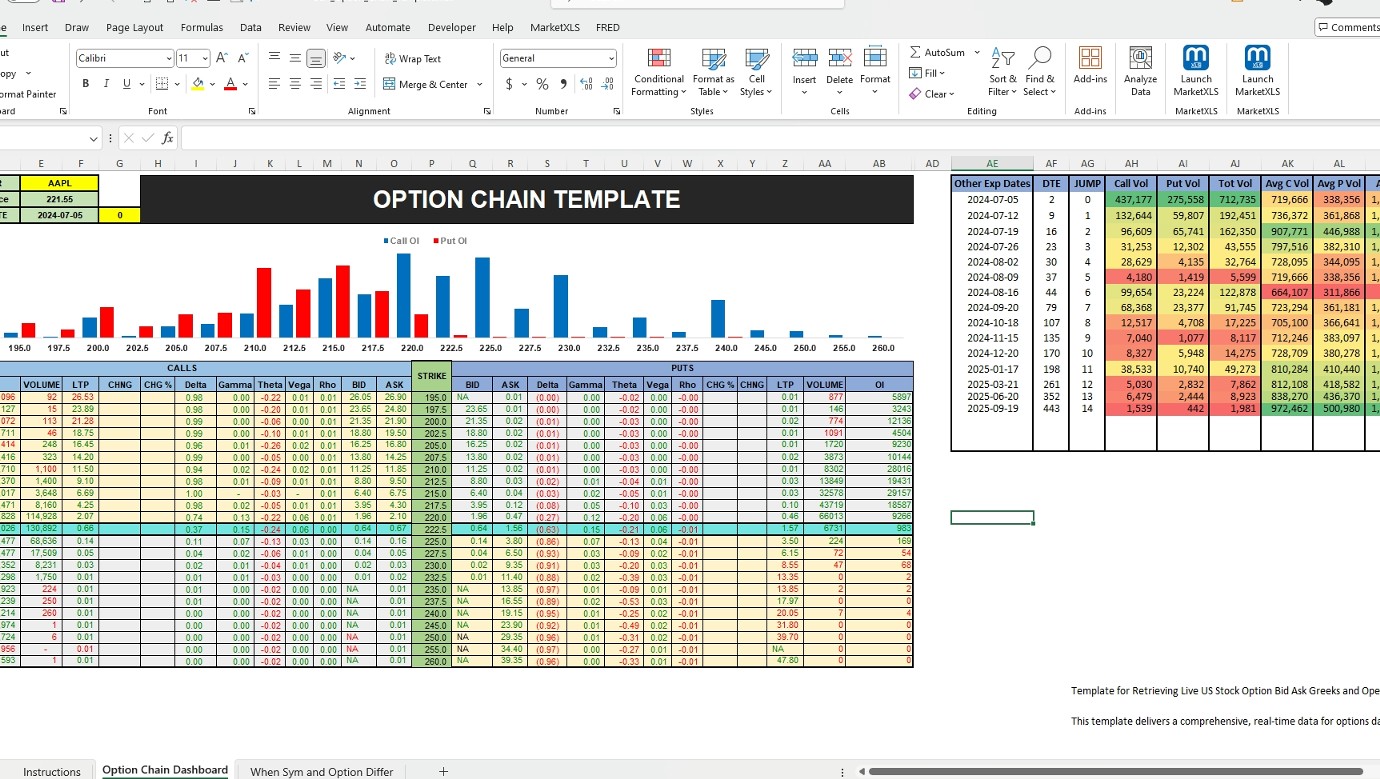
OptionSymbol(ticker, strike, "Call", expDate)Creates the symbol for the ATM call option - Example: MSFT 422.5 Call
- Put Option:
OptionSymbol(ticker, strike, "Put", expDate)Creates the symbol for the ATM put option - Example: MSFT 422.5 Put
Implied Volatility Calculation
- Call IV:
opt_ImpliedVolatility(ticker, callPrice, expDate, "Call", strike, 0.05)Calculates implied volatility for the call option - Example: MSFT Call IV = 0.318185
- Put IV:
opt_ImpliedVolatility(ticker, putPrice, expDate, "Put", strike, 0.05)Calculates implied volatility for the put option - Example: MSFT Put IV = 0.295719
- Average IV:
AVERAGE(CallIV, PutIV)Combines call and put IV for a balanced measure - Example: MSFT Average IV = 0.306952
Expected Move Formula
Copy
Expected Move = CurrentPrice × AverageIV × √(DaysToExpiration/365)
In Excel format:
excel
Copy
=Last(ticker) * AVERAGE(CallIV, PutIV) * SQRT(DTE/365)
Example Calculation
For Microsoft (MSFT):
- Current Price: $422.37
- Days to Expiration: 2
- Average IV: 0.306952
- Expected Move: $9.5969
This means the stock is expected to move up or down by approximately $9.60 before expiration.
Notes
- All prices should be current market prices
- The 0.05 in the implied volatility calculation represents the risk-free rate
- The calculation uses calendar days, not trading days
- The expected move is symmetrical (same magnitude up or down)

Created by: Ankur
Interested in building, analyzing and managing Portfolios in Excel?
Download our Free Portfolio Template
Call: 1-877-778-8358 

Welcome! I'm Ankur, the founder and CEO of MarketXLS. With more than ten years of experience, I have assisted over 2,500 customers in developing personalized investment research strategies and monitoring systems using Excel.
I invite you to book a demo with me or my team to save time, enhance your investment research, and streamline your workflows.
I invite you to book a demo with me or my team to save time, enhance your investment research, and streamline your workflows.
Implement "your own" investment strategies in Excel with thousands of MarketXLS functions and templates.
MarketXLS provides all the tools I need for in-depth stock analysis. It's user-friendly and constantly improving. A must-have for serious investors.
I have been using MarketXLS for the last 6+ years and they really enhanced the product every year and now in the journey of bringing in AI...
MarketXLS is a powerful tool for financial modeling. It integrates seamlessly with Excel and provides real-time data.
I have used lots of stock and option information services. This is the only one which gives me what I need inside Excel.
Meet The Ultimate Excel Solution for Investors
Live Streaming Prices in your Excel
All historical (intraday) data in your Excel
Real time option greeks and analytics in your Excel
Leading data service for Investment Managers, RIAs, Asset Managers
Easy to use with formulas and pre-made sheets


