In this article, we will look at how we estimate the volatility based on the history of a stock price movement. With MarketXLS, you can simply use the stock volatility function to turn Excel into the stock volatility calculator.
Volatility comes in various forms and what MarketXLS volatility functions return is the simplest form of volatility. It is calculated by first calculated by the daily return on the stock and then taking the standard deviation on those daily returns. It can serve you well when you are comparing multiple stocks in your portfolio for its volatility.
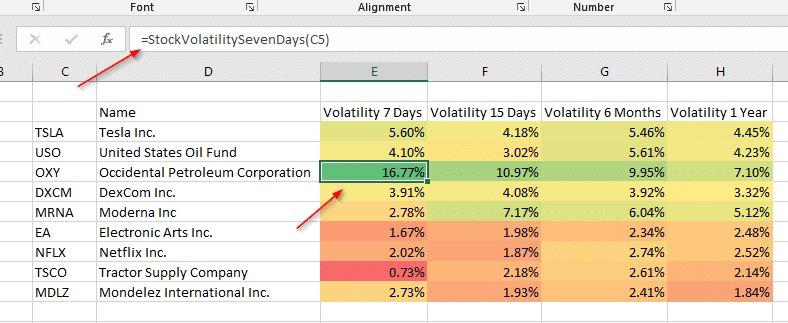
The example below shows you a simple volatility comparison table of the stocks in a hypothetical portfolio.

stockvolatility
MarketXLS Stock Volatility Functions
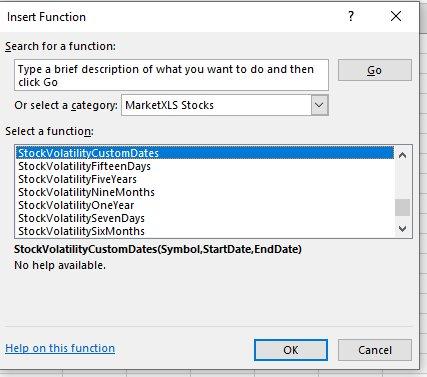
MarketXLS provides you with the following functions to quickly calculate the stock volatility without you having to calculate the returns, or download historical stock prices. We perform all those calculations on the MarketXLS server and all you have to do is use this function to get the value.

stock volatility calculator
Some functions have a pre-defined period like seven days, 15 days, nine months, and so on. But you can also use the Stock Volatility Custom dates function to calculate the volatility on the stock returns over a custom historical period as shown below.
!
MSFT.png” alt="”stock"volatility formula” width="”451″"height="”162″"/>
Just like, the volatility functions MarketXLS has other functions to calculate the cumulative stock returns using the functions like =StockReturnSevenDays(“MSFT“)
MarketXLS provides you with hundreds of custom functions to help you quickly analyze the stock data. Use these functions as your stock volatility calculator in Excel. Stock volatility simply refers to the severity with which the price of the stock fluctuates on a daily basis. And when comparing various investments this measure could be very useful in making investment decisions.
Beta vs Volatility
Both beta and volatility are measures of risk, sometimes these two may be confused. For example, a stock may have a higher beta and lower volatility when compared to other stock. The main difference between the two is that volatility is the total risk (Market Risk + Firm-Specific risk) whereas the Beta is just the market risk. So, the Beta will tell us the percentage change in the stock return given a one percent change in the return of the market.
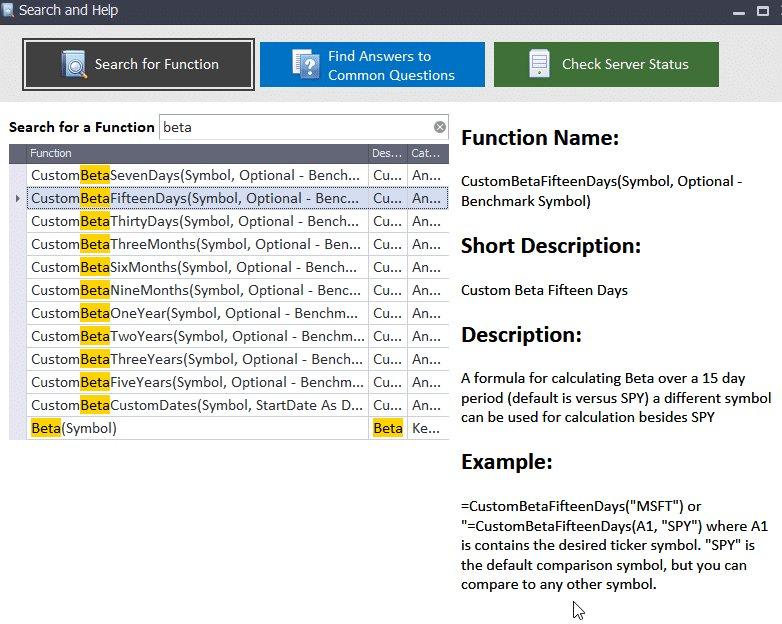
Similar to the stock volatility functions you can also use MarketXLS’s CustomBeta functions to calculate the Beta on the stocks.

Stock Beta Functions
