

!
In this article, we will look at how you can use MarketXLS’s portfolio beta calculator template to easily calculator Beta of your portfolios. MarketXLS has a very strong portfolio analytics engine that can get you all kind of analysis of your portfolio with easy to use Excel functions
What is Beta?
Beta is a way to measure the Systematic Risk. Let’s say you are considering investing in an Amazon INC. Stock AMZN and you want to find out the total risk in that investment. You can also think about “risk” as the volatility of the movement in the price. Now, the overall risk is a combination of up of Systematic Risk and Unsystematic risk.
Unsystematic risk comes from company-specific events. For example, the company’s profits were not up to expectations. Or if there was some news in the market that was just about the company.
The company, however, can also be affected by the systematic risk, which is the risk that comes from the market-wide conditions, for example, change in interest rates, etc.
In most cases, if you have a portfolio of multiple stocks, the unsystematic risk is diversified away as you have various stocks in your portfolio of stocks. As the number of stocks in your portfolio increases, the volatility decreases. So, you look at systematic risk when investing and figuring out what kind of risk premium you would want to pay as an investor.
So, to measure the systematic risk, you use the Beta. In most simple terms, the Beta of a stock is the percentage change in the stock’s return, given a 1% change in the market. So, a Beta of 1.5 that if the market portfolio moves by 1%, the stock could likely move by 1.5%.
Generally, you would use the Index to which the stock belongs to, to calculate the Beta. In MarketXLS, the default =StockBeta uses the ETF SPY to calculate the Beta.
So, the Beta tells us how tied in are the returns of one stock to the overall market conditions. You can also think about the systematic risk as to the “Market Risk” of a stock.
Calculate the Beta of an Entire portfolio
To calculate the Beta of the entire portfolio, you will take the weighted average of the Beta of individual stocks in the portfolio. The weights will be the proportion of the amount you invested in each stock vs. the total invested amount in your portfolio.
Use MarketXLS’s Portfolio Beta Calculator
In MarketXLS, there are many stock related analytical functions that are available, along side many Beta functions. The Beta functions as shown below can be used to instantly return the Beta of a stock over various number of periods of time.
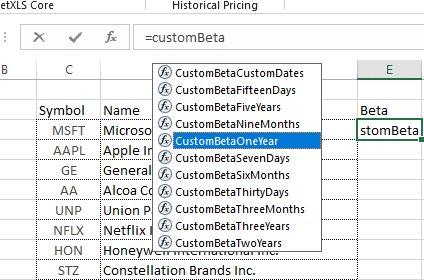
portfolio beta calculator
Assume that your portfolio looks like as shown in the image below. The column D shows the invested amount on each of these stocks. The column F uses the MarketXLS formula =CustomBetaOneYear(stock) to return the Beta value. Then we simply take the weighted average of the beta with weights in the portfolio.
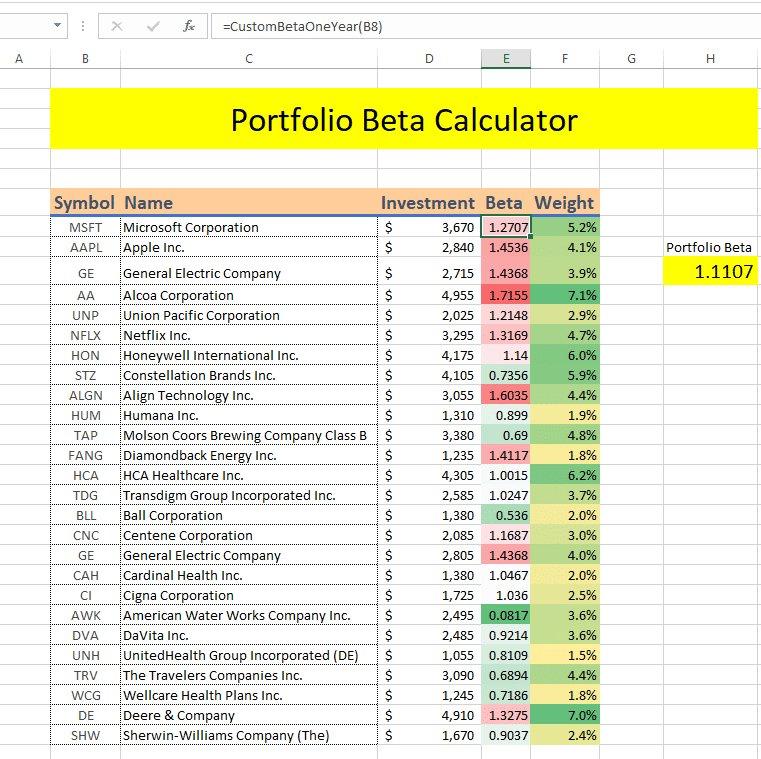
portfolio beta calculator
As you can see our Portfolio Beta is 1.1107.
With our new functions you can calculate the portfolio Beta for stocks and ETFs portfolio by simply using a function =PortfolioBeta(Portfolio, Period) as shown below.
