
The Wealth Index of portfolio with MarketXLS calculates the highest rate of return for the investment. The MarketXLS add-in enables it to apply to either financial instrument or business portfolios. The wealth index is a popular function to evaluate the investment and to calculate the returns.
What is Wealth Index
The wealth index is a data series that presents the value of your portfolio at historical time periods explaining the portfolio’s value at different points in time corresponding to the returns generated by it.
Calculation of Wealth Index
Wealth is referred to as earnings, and wealth index means profits over investments. It is a metric used to evaluate the investments and deciding whether to go on with the same investments or to include other assets in the portfolio.
The return on investment can be calculated by using total return. The total return is the total amount of yield plus capital earning form the portfolio.

And if the investment does not pay the yield or capital gain, then the return can be calculated by using relative return.
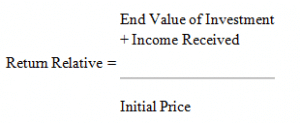
Both of the above formulas are used to calculate the return on individual investment.
Cumulative Wealth Index
The cumulative wealth index (CWI) is simply the return, expressed as a decimal multiple of the initial amount, earned by a certain initial amount of money over years. The calculation usually uses $1 as the initial investment, and the returns are compounded annually:
CWIn = WI0 × (1 + TR1) × (1 + TR2) × … × (1 + TRn)
Where:
WI0= Initial wealth
TR = Total Return
n = No. of years
Geometric Mean
The geometric mean is more accurate than the arithmetic mean because it accounts for compounding:
Geometric Mean = [(1+ TR1) (1+ TR2) … (1+ TRn)] 1/n – 1
where:
TR = Total Return
n = No. of years
The geometric mean will usually yield the correct, accurate result, but the example was off a little because of rounding errors in the data. Total returns can also be adjust for inflation by dividing the total return over a given period by the inflation rate over that same period, usually one year.
How MarketXLS Calculates Wealth Index of your Portfolio
MarketXLS® completely automates the process of calculating the wealth index using excel to get the optimal portfolios by calculating the wealth index.
The following inputs are required to be entered by the investor:
1. Symbol of the asset: Enter the ticker under which the security in your Portfolio is traded.
2. Weight of the asset in your Portfolio: Enter the percentage weight of each security, as shown below.
Input:
Optional Input:
Initial Investment: Enter the amount you invested initially to derive a data series that explains the present value of your portfolio.

