Stock charts in excel


You can use MarketXLS to create stunning, dynamic, customizable, stock charts in Excel
New methodology of pulling in Crypto data in your Excel
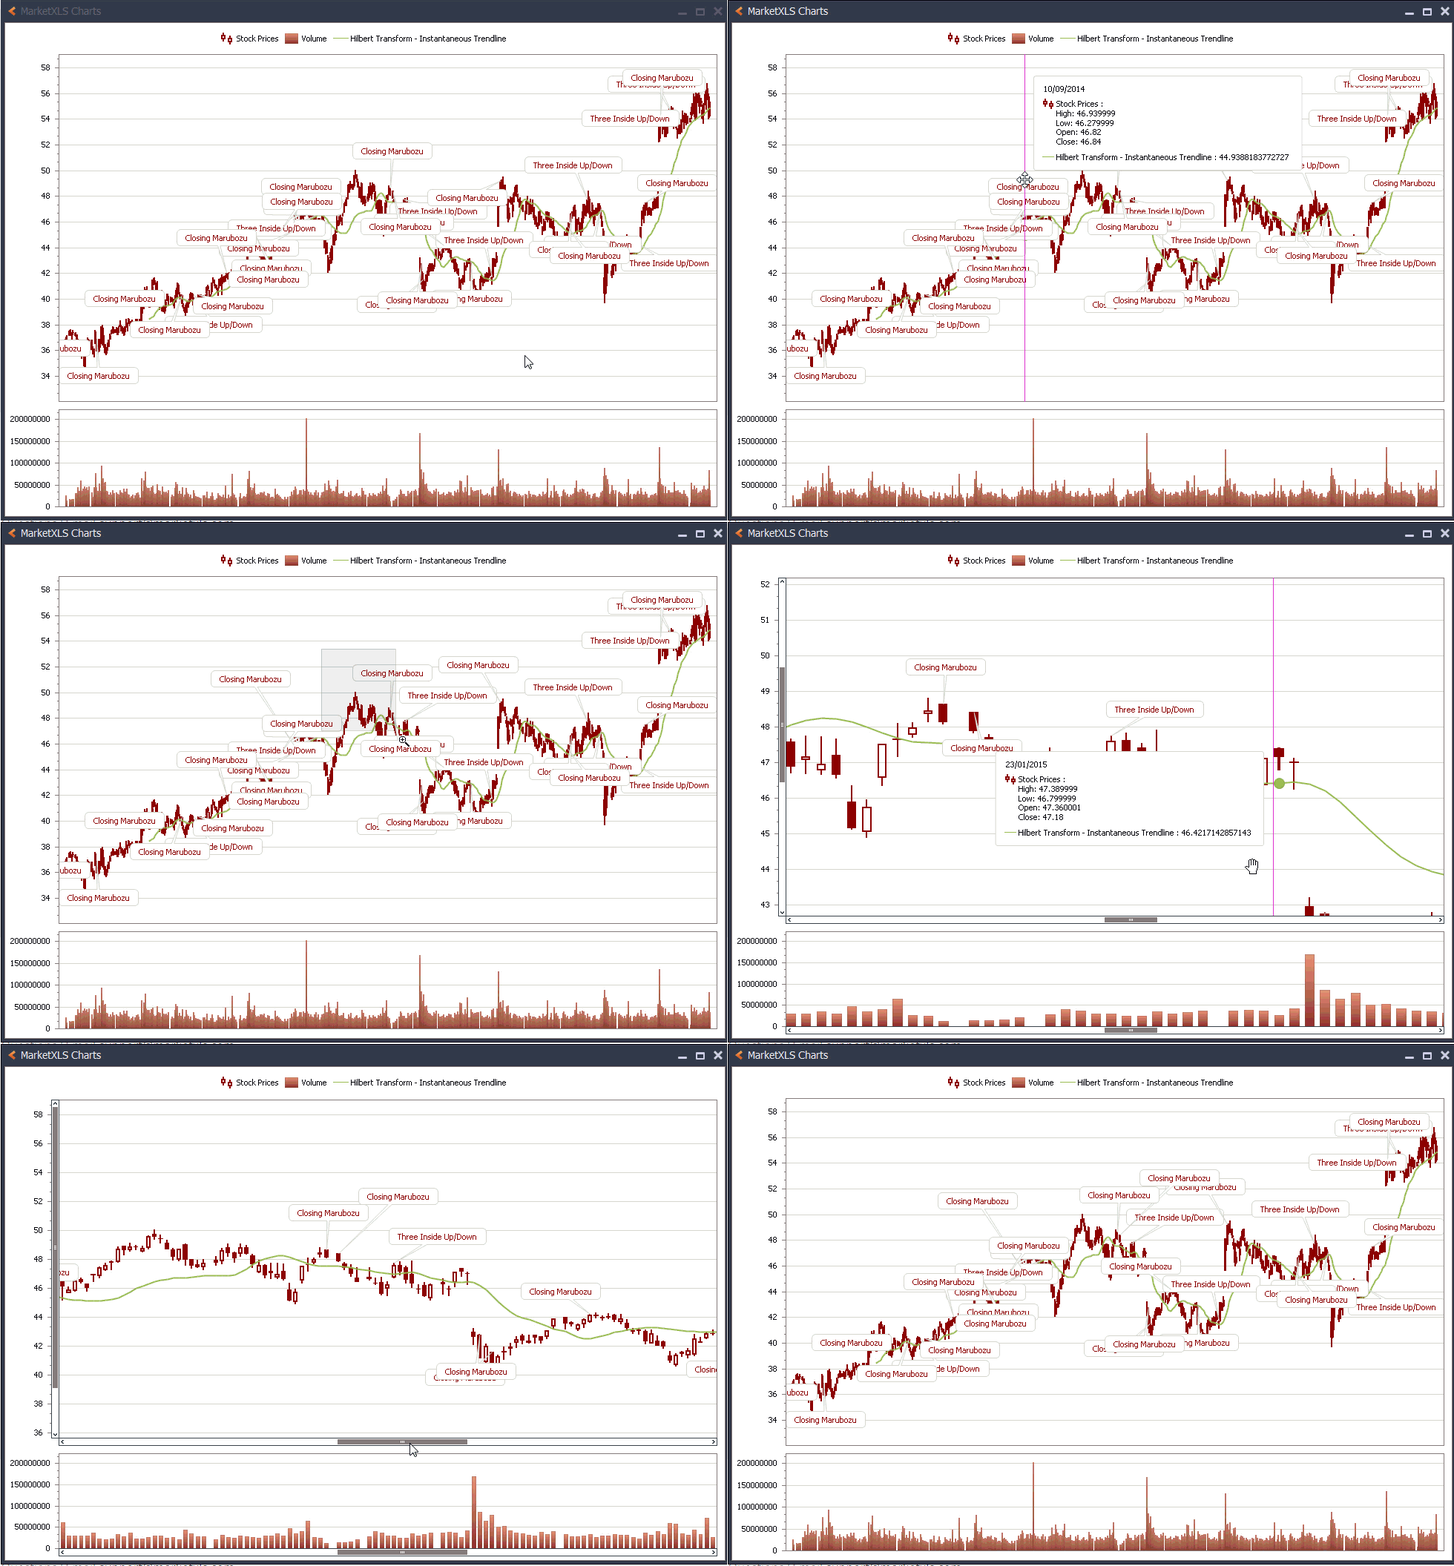
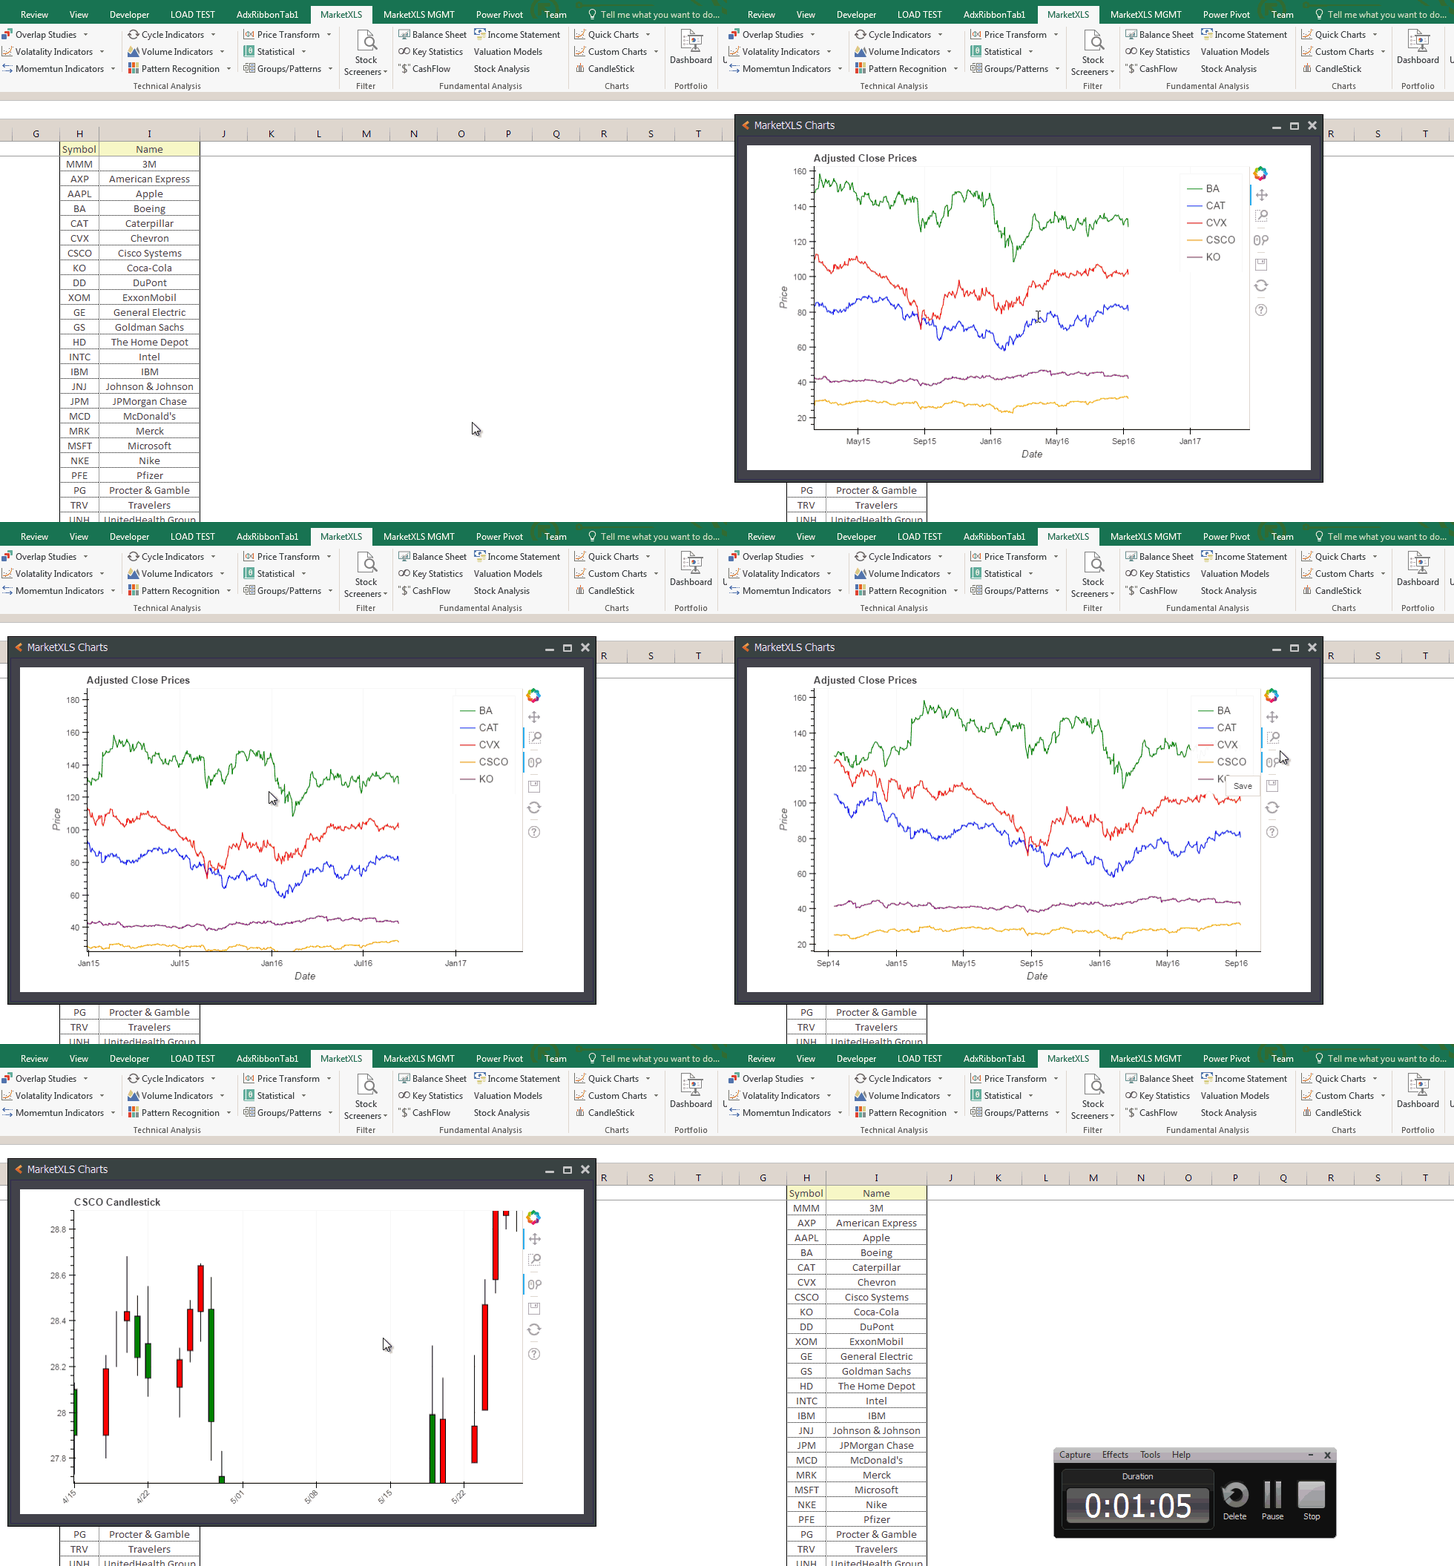
Create ready-made stock charts in Excel and make charts with your own dataset in Excel. Customize your charts, add panels, in-built indicators, multiple axes and so on. Zoom in - Zoom out of charts with dynamic date format handling. Export charts you make in multiple formats, copy as PNG, share on Twitter or StockTwits quickly. Annotate Candlestick patterns on the charts.
MarketXLS charting engine uses Excel's range objects to automatically identify chart data to save you time. Maximize charts without any distortion of quality. Open multiple charts windows at a time. MarketXLS charts are much more interactive and dynamic than the native Excel charts.
Chart Examples
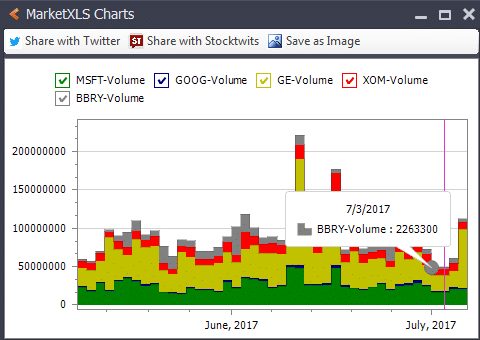
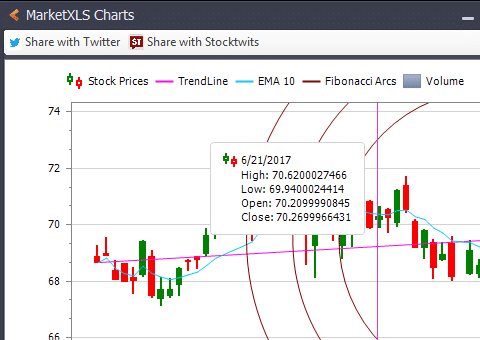
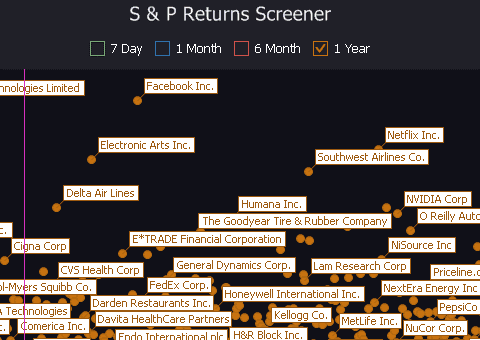

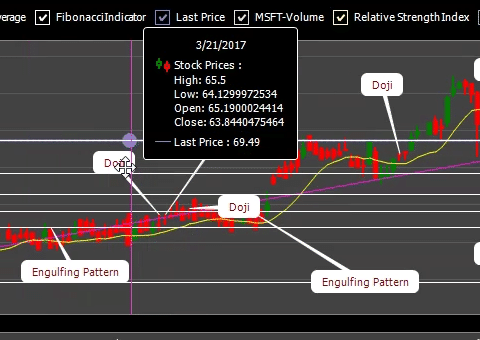
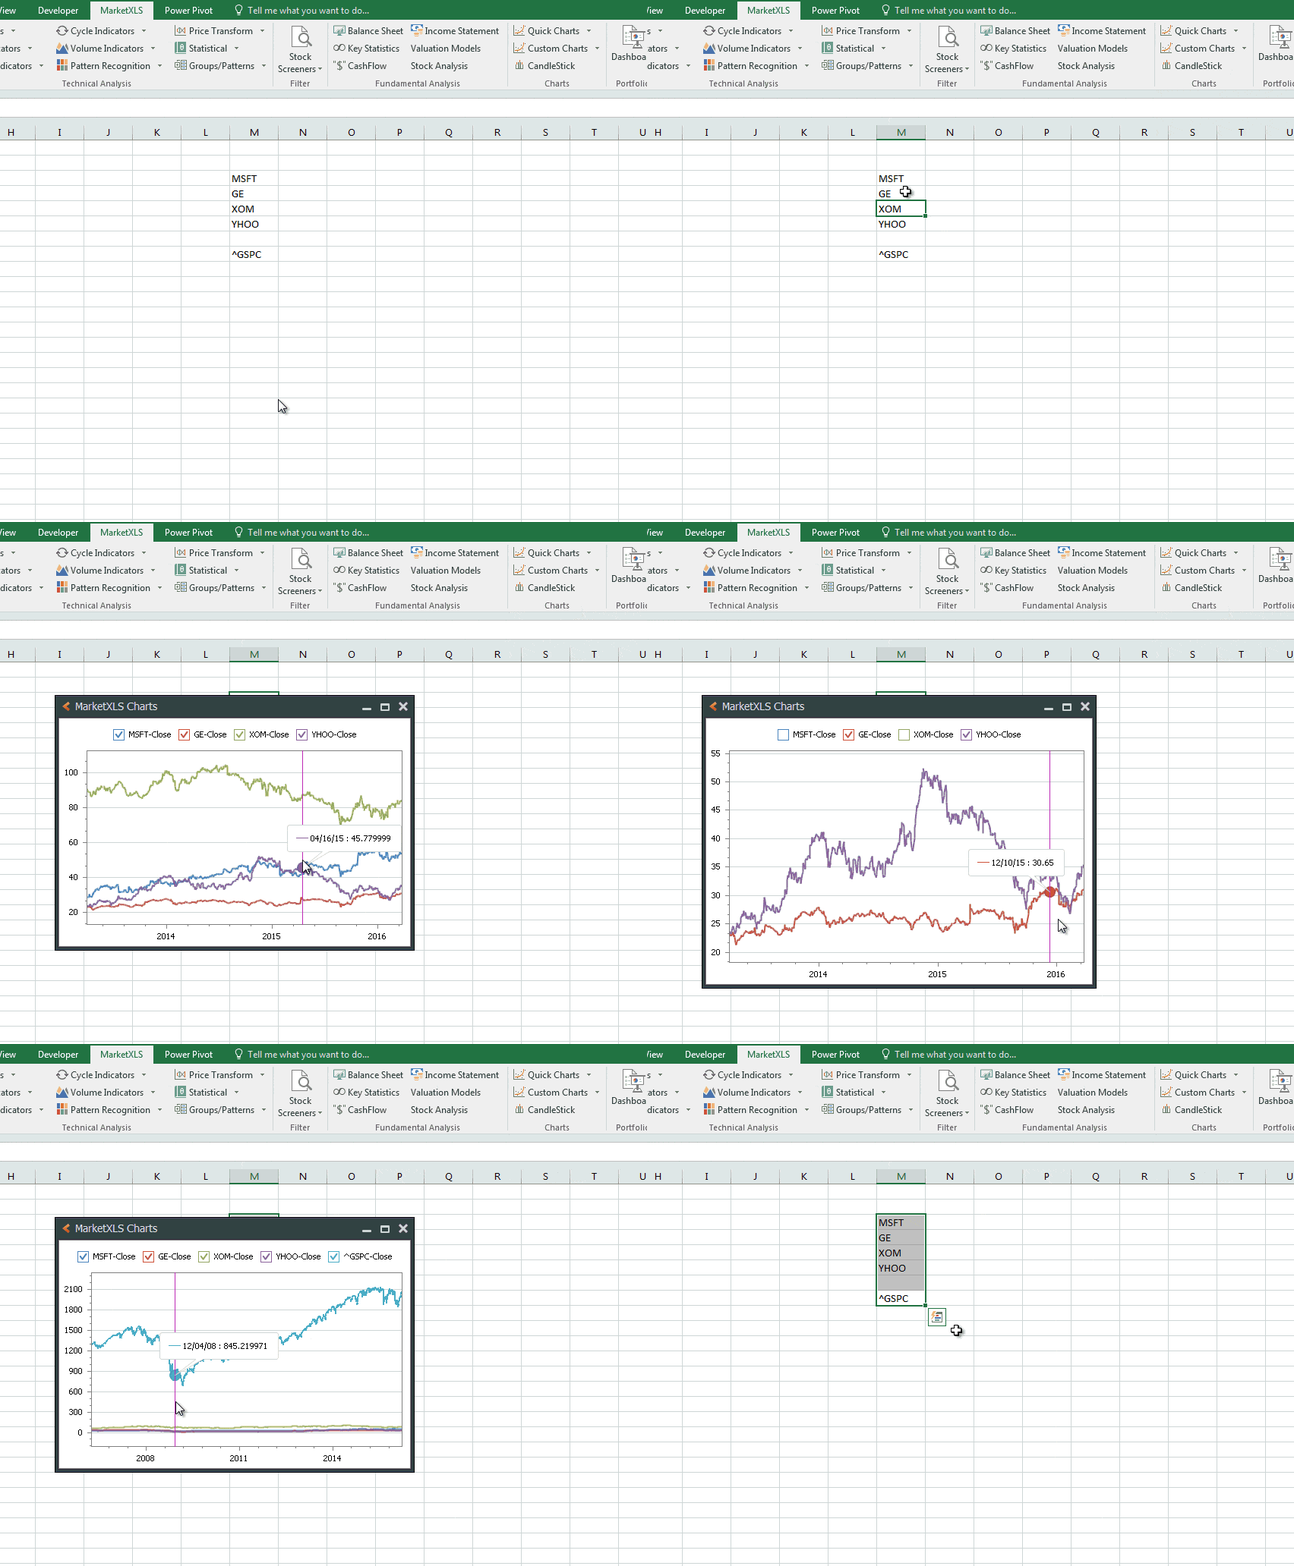
Simply select a group of stocks and click on these to get the charts like shown below to create stock charts in excel
New methodology of pulling in Crypto data in your Excel
Stock Quotes in Excel Add-in from MarketXLS has everything you would need as an investor to manage all your stock portfolio needs within Excel. The add-in is designed to fit right within your workflow and provides you the required data the way you want. You can plugin this data within your financial models or portfolio spreadsheets and the data will refresh automatically keeping your numbers always latest.
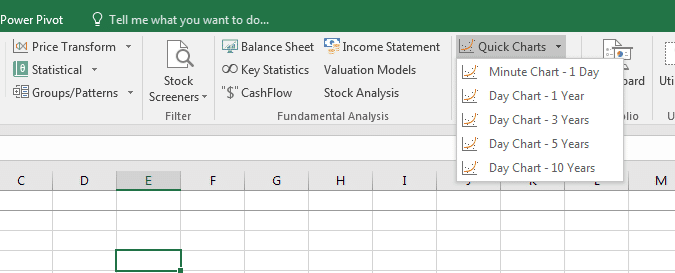
You can use the MarketXLS charting functionality to build charts for a single stock or multiple stocks. The quick charts functionality allows you to draw charts for a variety of time periods such as daily closing prices for one year, three years or even more. You can also plot Candlestick charts and annotate them. You can also use the MarketXLS charting to plot custom charts based on your own dataset as an alternative to native excel charts.
Other than data visualization and stock charts in excel, the MarketXLS add-in also provides live and delayed data for stock quotes, futures, options, ETFs, and currency quotes, and historical stock data in excel. The add-in also provides all the fundamental and technical data for the stocks including balance sheet, income statement, and cashflow metrics and hundreds of technical indicators and charts.
Supercharge your stock research with MarketXLS.
Questions? Email support@marketxls.com
Call: 1-877-778-8358 

Welcome! I'm Ankur, the founder and CEO of MarketXLS. With more than ten years of experience, I have assisted over 2,500 customers in developing personalized investment research strategies and monitoring systems using Excel.
I invite you to book a demo with me or my team to save time, enhance your investment research, and streamline your workflows.
I invite you to book a demo with me or my team to save time, enhance your investment research, and streamline your workflows.
Implement "your own" investment strategies in Excel with thousands of MarketXLS functions and templates.
MarketXLS provides all the tools I need for in-depth stock analysis. It's user-friendly and constantly improving. A must-have for serious investors.
I have been using MarketXLS for the last 6+ years and they really enhanced the product every year and now in the journey of bringing in AI...
MarketXLS is a powerful tool for financial modeling. It integrates seamlessly with Excel and provides real-time data.
I have used lots of stock and option information services. This is the only one which gives me what I need inside Excel.