Stock Drawdown

What is a drawdown?
A drawdown (usually understood as maximum stock drawdown) is an indicator of downside risk over a specified period of time. It is both highly useful when analyzing a potential investment and also easy to understand for professionals and non-professionals alike. A drawdown is defined as a peak-to-trough decline over a specified time period for an investment (a portfolio of stocks, bonds, a fund, or individual stock or bond).
It is typically quoted as the percentage between a peak and the subsequent trough.
Why focus on the downside risk only?
Traditional measures of risk in investing are beta and the Sharpe ratio. The problem with both of these measures is that they treat both positive and negative deviation from the average market return as factors that increase risk. This means that the traditional measures will penalize a stock that has consistently outperformed the market, and they will mark such a stock as “risky”.
We at MarketXLS believe that risk measures, which focus exclusively on the downside, are more relevant to investors.
Apple Inc. as an example
We shall demonstrate how drawdown works by using daily closing prices of AAPL stock, adjusted for stock splits and dividends.
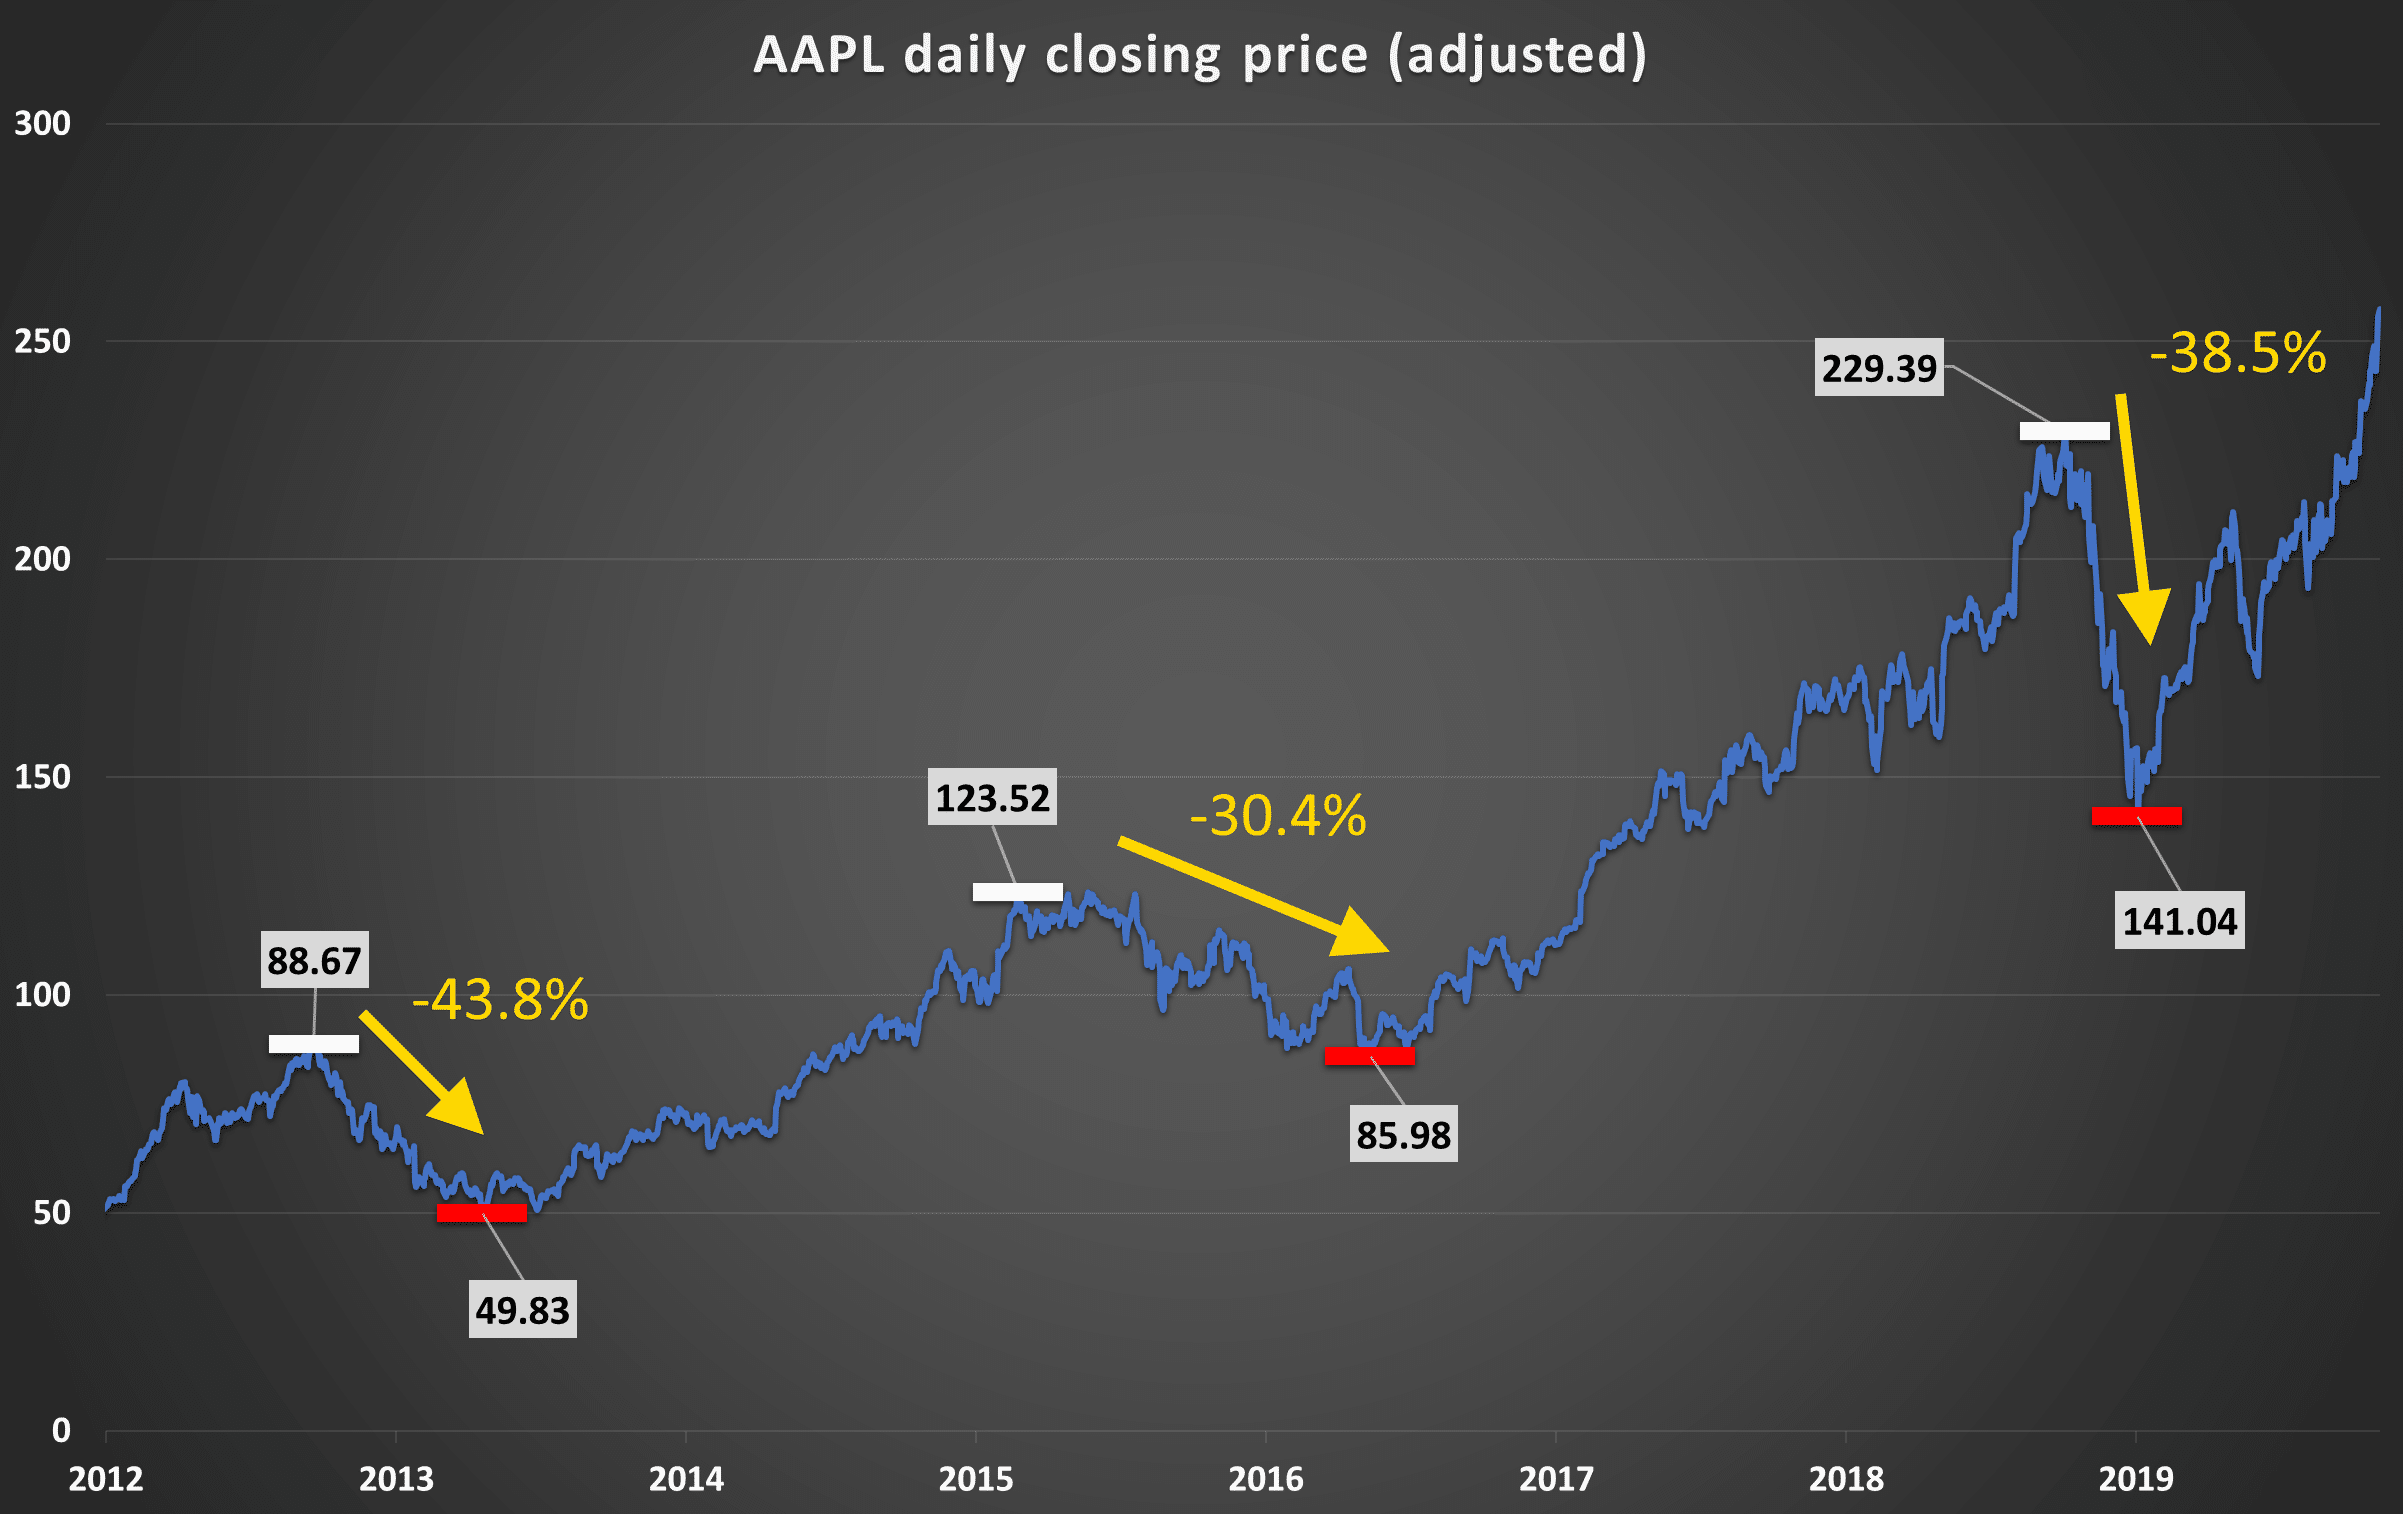
Between the beginning of 2012 and the time of writing this post (November 2019), AAPL stock has experienced three major drawdowns, with the stock price declining 43.8%, 30.4%, and 38.5%, respectively, from the prior peaks.
Drawdown percentage is the answer to the question: if someone had bought this investment at the time of its highest price, and later sold it at the bottom, just before the investment price began to recover, how much had he lost? In other words, a drawdown represents the worst-case scenario which an investor into a particular portfolio, fund, or stock could have experienced, over the defined time period.
Drawdown is measured on a daily level. It is always a negative number unless a new high for the stock is attained, in which case the value of drawdown is zero. Here is a chart of daily drawdowns for AAPL:
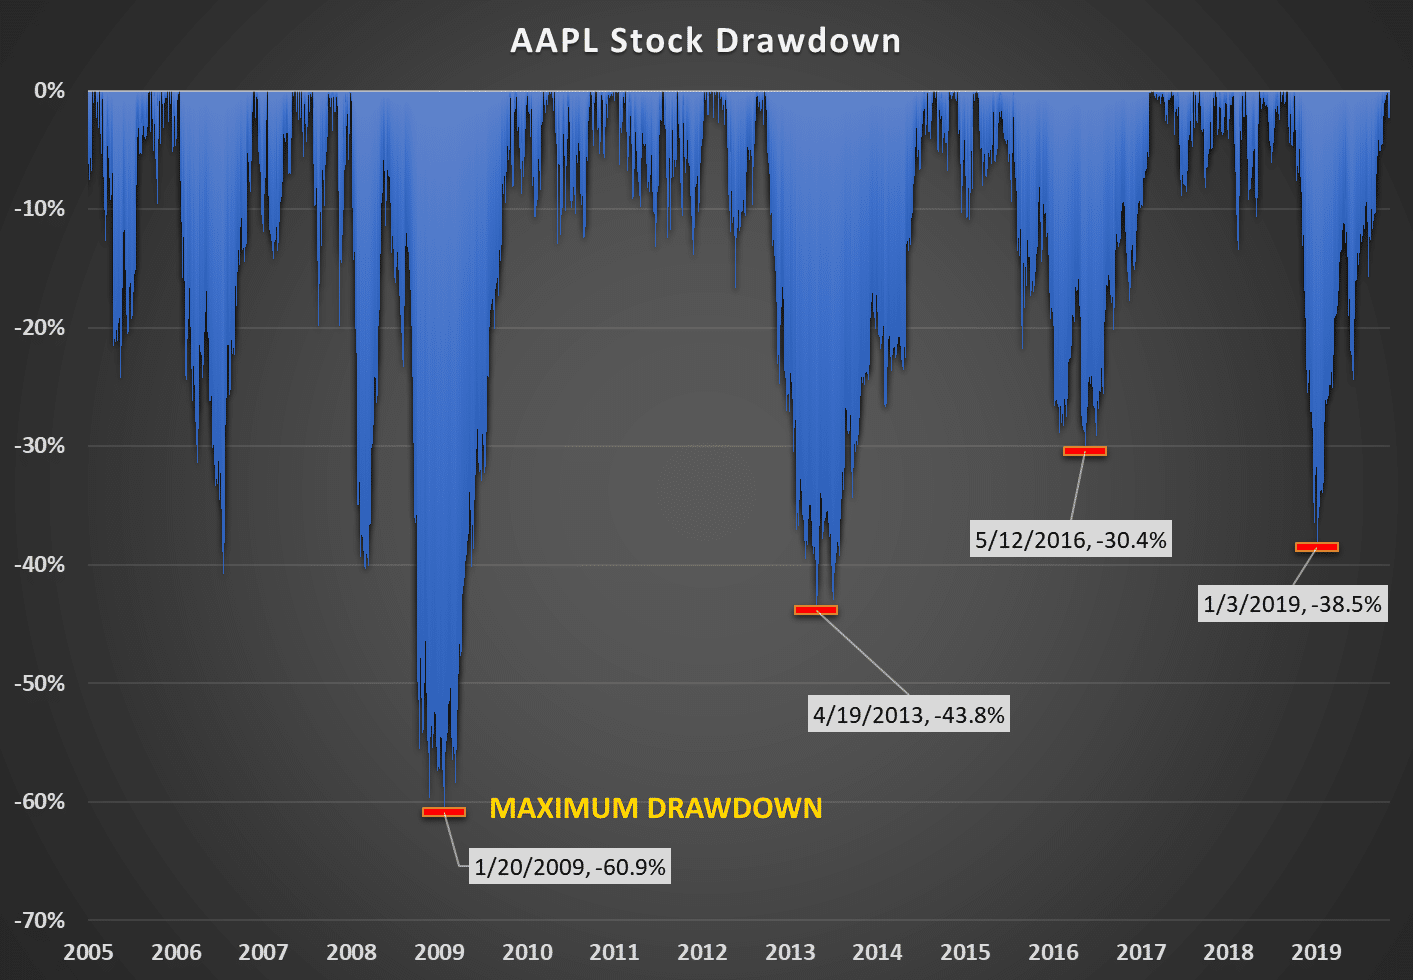
While it is measured daily, as investors and/or analysts we are interested in the maximum drawdown (MDD) over the observed period. Our goal is to pick investment opportunities with the least amount of downside risk, for the expected return potential.
How to use Stock drawdown functions in MarketXLS
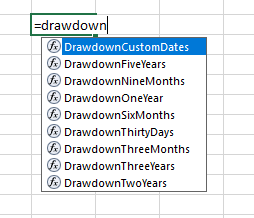
MarketXLS offers a set of stock drawdown functions, which save you a lot of tedious work which would be needed to calculate MDD for even a single stock. With our add-in capabilities, you can get the results for hundreds of selected stocks in a matter of minutes.
By default, analysts usually look for a 5-year drawdown, as the period is sufficiently long to make estimates about longer trends, yet it is also not too long to have the result be influenced by events that may be irrelevant for the current investment decisions. On the other hand, investors may also want to see how a particular set of stocks performed during the Great Recession.
If we want to find the maximum drawdown which AAPL stock experienced since January 1st, 2007, we will type:
=DrawdownCustomDates(“AAPL“,1-1-2007,TODAY())
On the other end of the strategy spectrum, short-term traders may be interested in maximum drawdowns over shorter time periods.
All returns are not equal
When constructing a portfolio, one must always have his goals, time horizon and personal risk tolerance in mind. Occasional heavy price corrections, or even a market crash or two are to be expected over an investor’s time horizon.
For example, when preparing a retirement portfolio, investment advisors would usually suggest limiting portfolio drawdown risk to -20%. If riskier stocks are included in the portfolio, their downside should be balanced by safer investments, with less downside risk. This is because once retired, the retiree will withdraw a portion from his retirement plan every year.
To keep the principal of the portfolio intact, up until recently investment advisors suggested that a retiree could annually withdraw 4% of their portfolio market value. (As of late, they have been talking about 3%.) If a portfolio experiences a significant drawdown, while an investor withdraws funds out of it, it will cut into the principal and it will create funding problems over the course of the retirement.
Even if you are a young investor and are creating a more aggressive, growth-oriented portfolio, you would do yourself a favor in being mindful of the downside risk, and we at MarketXLS are providing you with the tools that you need for it.
For a basic illustration of the information you can uncover with our drawdown functions, we will take a look at the performance of two companies’ stocks, Applied Materials (AMAT) and Home Depot (HD).
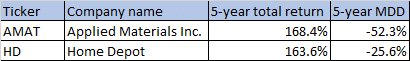
Over the past five years, AMAT delivered a slightly higher total return to shareholders than HD. However, in the periods of price correction, HD stock drawdown was only half as severe as AMAT drawdown. On a risk-adjusted basis, HD has actually outperformed AMAT.
Calculating the risk-adjusted rate of return
The most practical way to use drawdown to compare historical performance and risk between potential investments is the return over maximum stock drawdown (RoMaD).
RoMaD = total return of an investment / absolute value of maximum drawdown
Using our example of AMAT and HD, we can calculate that, for the last five years, their RoMaD ratios were 3.22 and 6.39, respectively. RoMaD can only be interpreted in a relative way, by comparing potential investments between them, where higher RoMaD implies a better investment.
While past performance does not guarantee nor predict future returns, maximum drawdown percent and RoMaD ratios are highly useful to identify which investment opportunities are more prone to risk, whether this risk stems from an inherently riskier company business model, or from market’s overreaction to occasional underperformance of the company.

I invite you to book a demo with me or my team to save time, enhance your investment research, and streamline your workflows.