

Earnings data in Excel, pulled live with MarketXLS formulas for EPS, revenue, growth rates, consensus estimates, and the next reporting date across 25 large-cap names.
Stock Analysis
Expert insights on stock market analysis, investment strategies, and Excel techniques for smarter investing.
Browse articles by topic, arranged in reading order.
Earnings data in Excel, pulled live with MarketXLS formulas for EPS, revenue, growth rates, consensus estimates, and the next reporting date across 25 large-cap names.
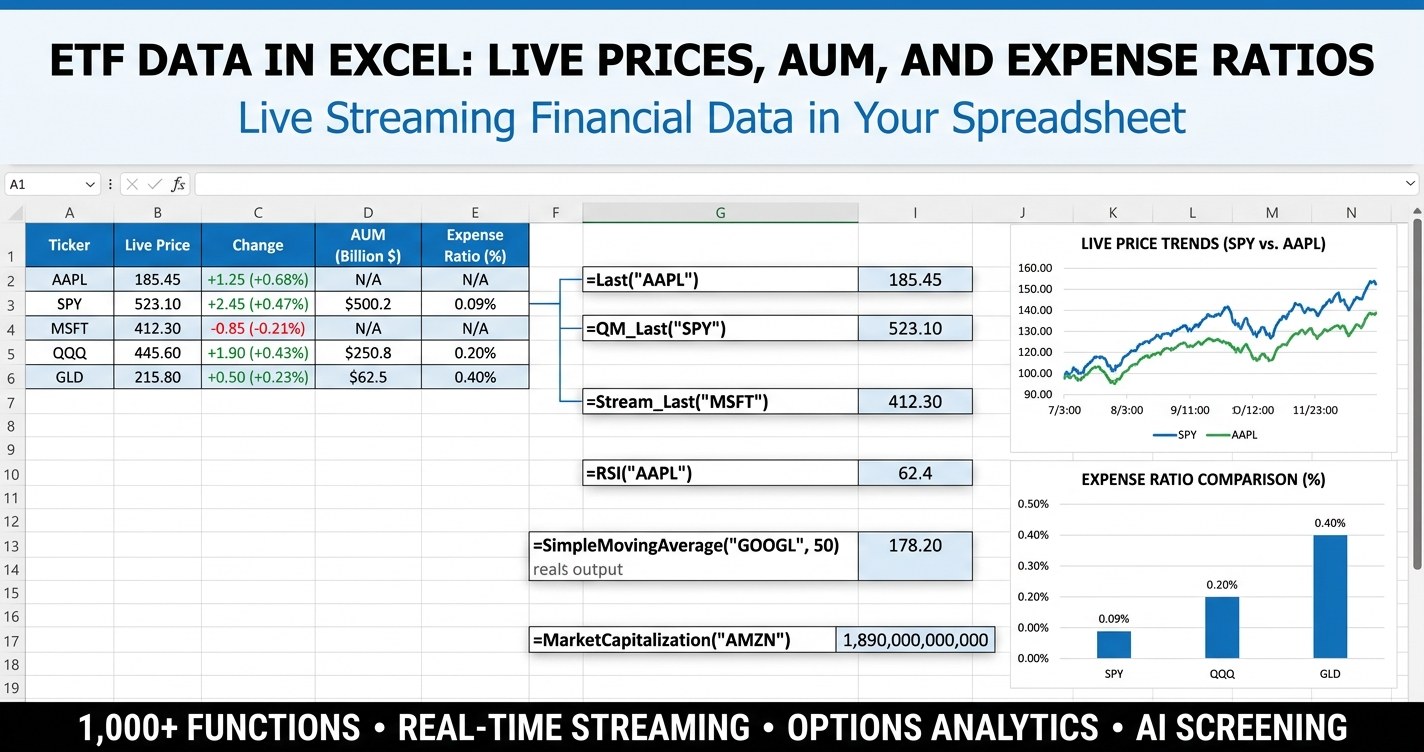
ETF data in Excel, pulled live with MarketXLS formulas for price, AUM, expense ratio, yield, YTD return, volatility, and top holdings across 25 well-known funds.

Pull any ETF's top holdings into Excel with =FundHoldings, then check overlap, concentration and sector exposure across funds. Free template included.
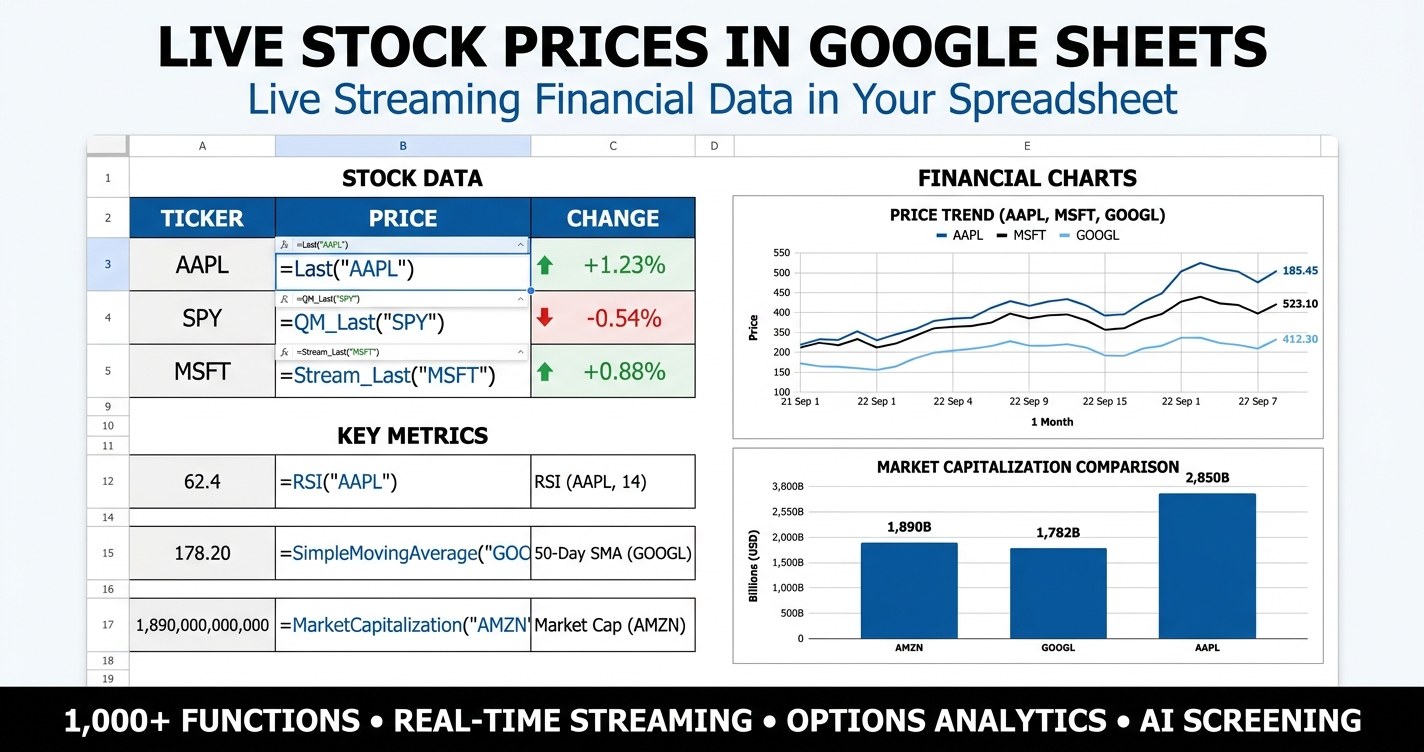
Live stock prices in Google Sheets sound simple until you push GOOGLEFINANCE past a small watchlist. This guide shows what GOOGLEFINANCE can and cannot deliver, how to map every common attribute to a MarketXLS formula, and how to set up a live, audit-friendly dashboard with downloadable templates.
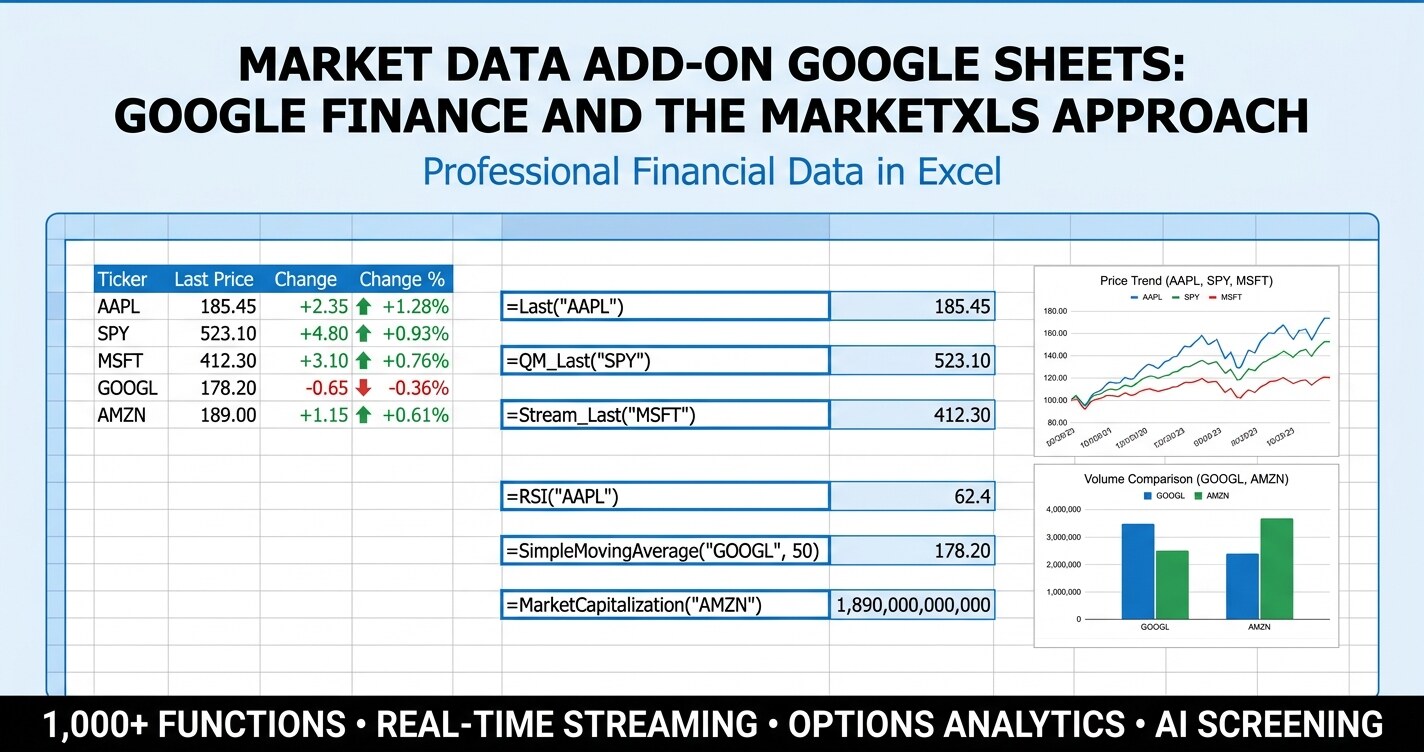
What GOOGLEFINANCE covers in Google Sheets, where it stops (options, dividends, fundamentals, technicals, ETF holdings), and the MarketXLS add-on formulas that fill each gap.
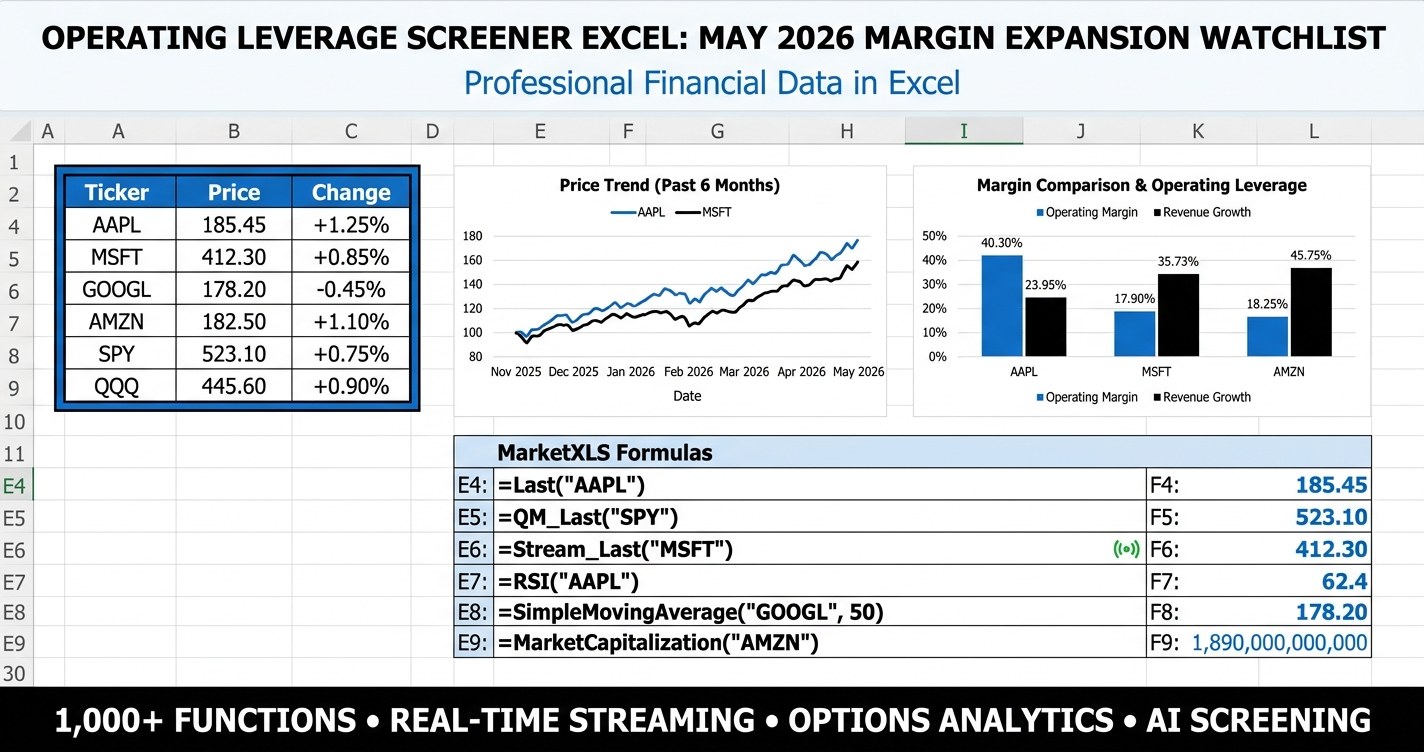
Operating leverage screener excel - rank stocks by Degree of Operating Leverage, margin trajectory, and growth so you can find names where revenue gains are amplifying into earnings growth this Q1 2026 earnings season. Free MarketXLS template inside.

GOOGLEFINANCE cannot return option prices. The MarketXLS Google Sheets add-on adds option quotes, chains, implied volatility, and Greeks with formulas like QM_Last(OptionSymbol(...)).
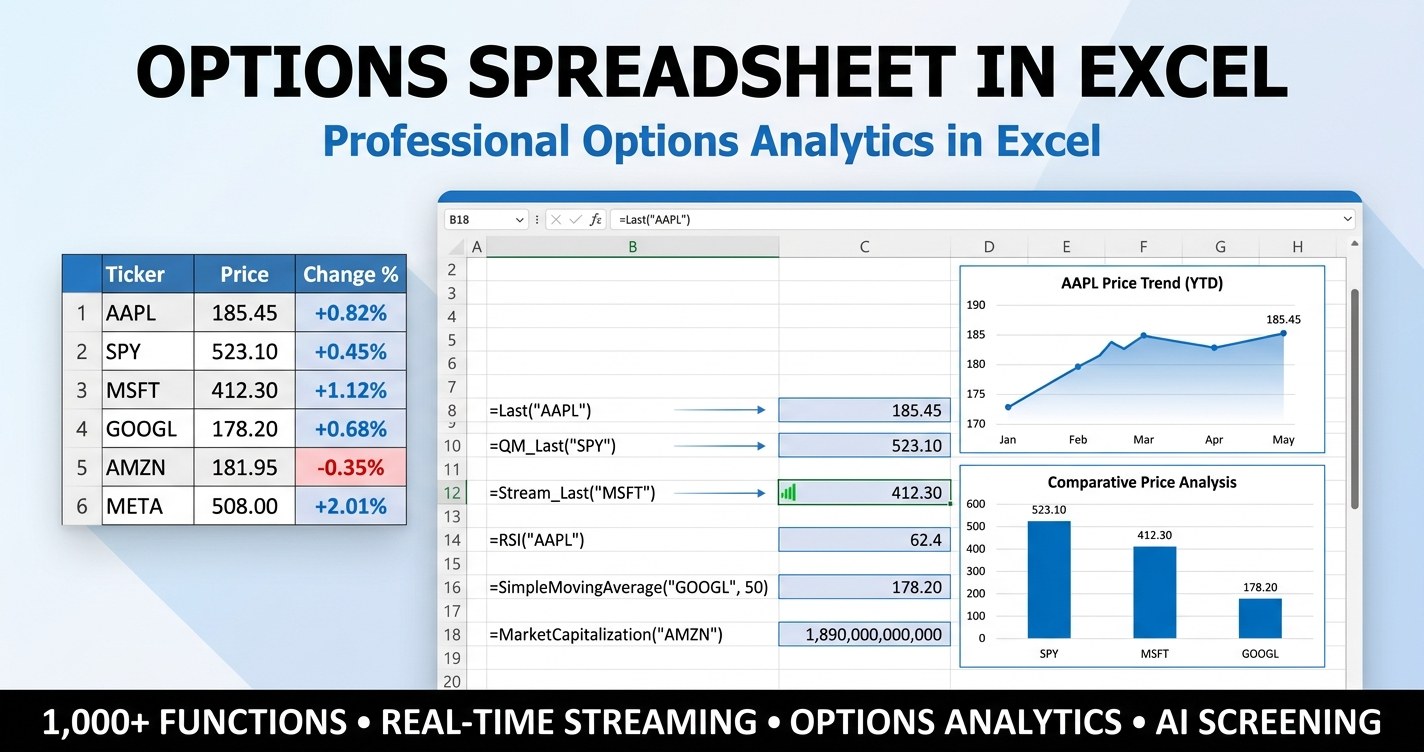
Options spreadsheet in Excel - a working template that pulls live prices, greeks, implied volatility, and option chain data with MarketXLS formulas so you can track every position in one workbook.

Options Trading in Excel Template - a covered call and cash-secured put income screener built with real MarketXLS formulas, ready for Q2 2026 conditions.

Pull S&P 500 historical data into Excel: ^GSPC or SPY index levels with =Adjusted_Close_Historical, component prices, sector weights, and multi-year returns with MarketXLS.

How to pull stock prices, fundamentals, and history into Google Sheets with the free GOOGLEFINANCE function, where it stops, and when the MarketXLS Google Sheets add-on or Excel add-in fills the gaps.

Get stock market data in Excel with MarketXLS formulas for price, daily change, moving averages, 52-week range, P/E, beta, and yield, plus a 30-ticker watchlist template.
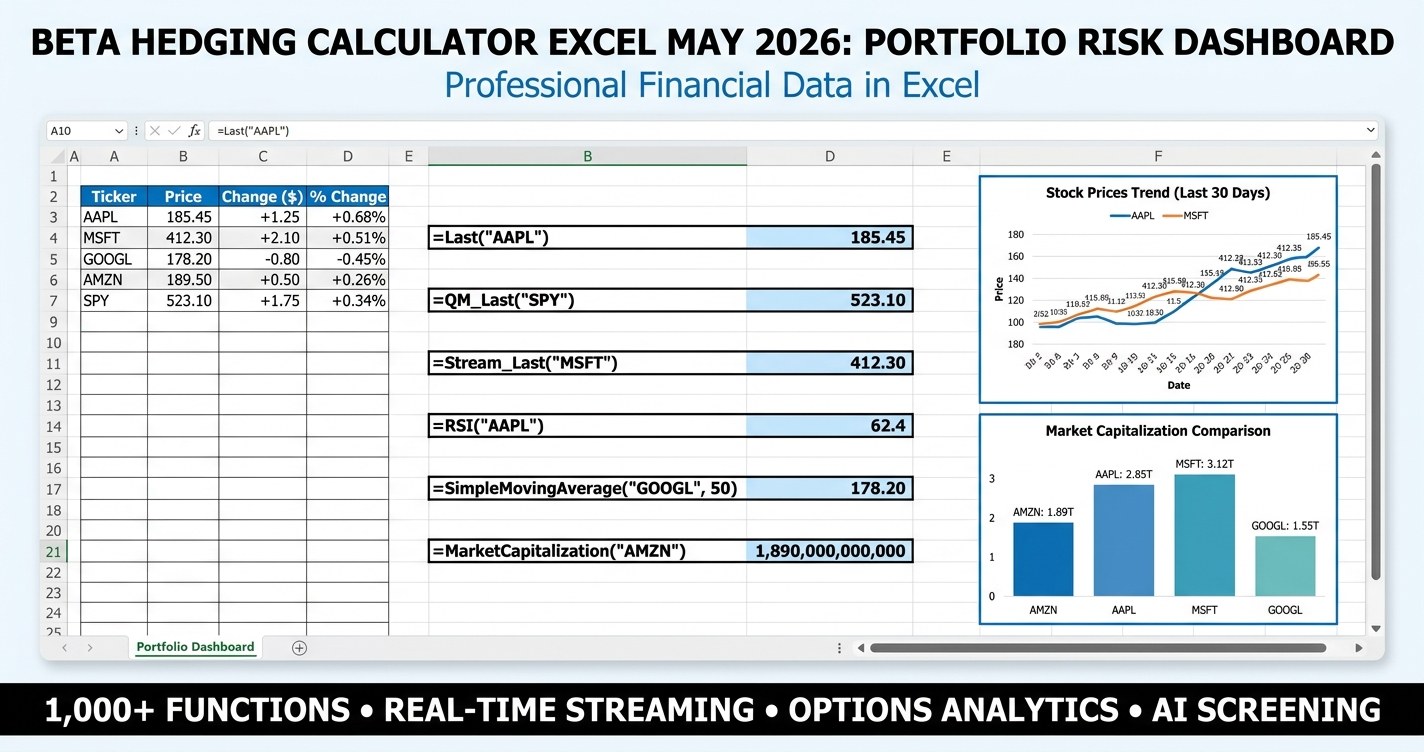
Beta hedging calculator excel - download a premium May 2026 portfolio risk dashboard that computes weighted portfolio beta, sizes the SPY/QQQ/IWM hedge in shares or put contracts, and runs scenario P&L unhedged vs hedged with live MarketXLS formulas.
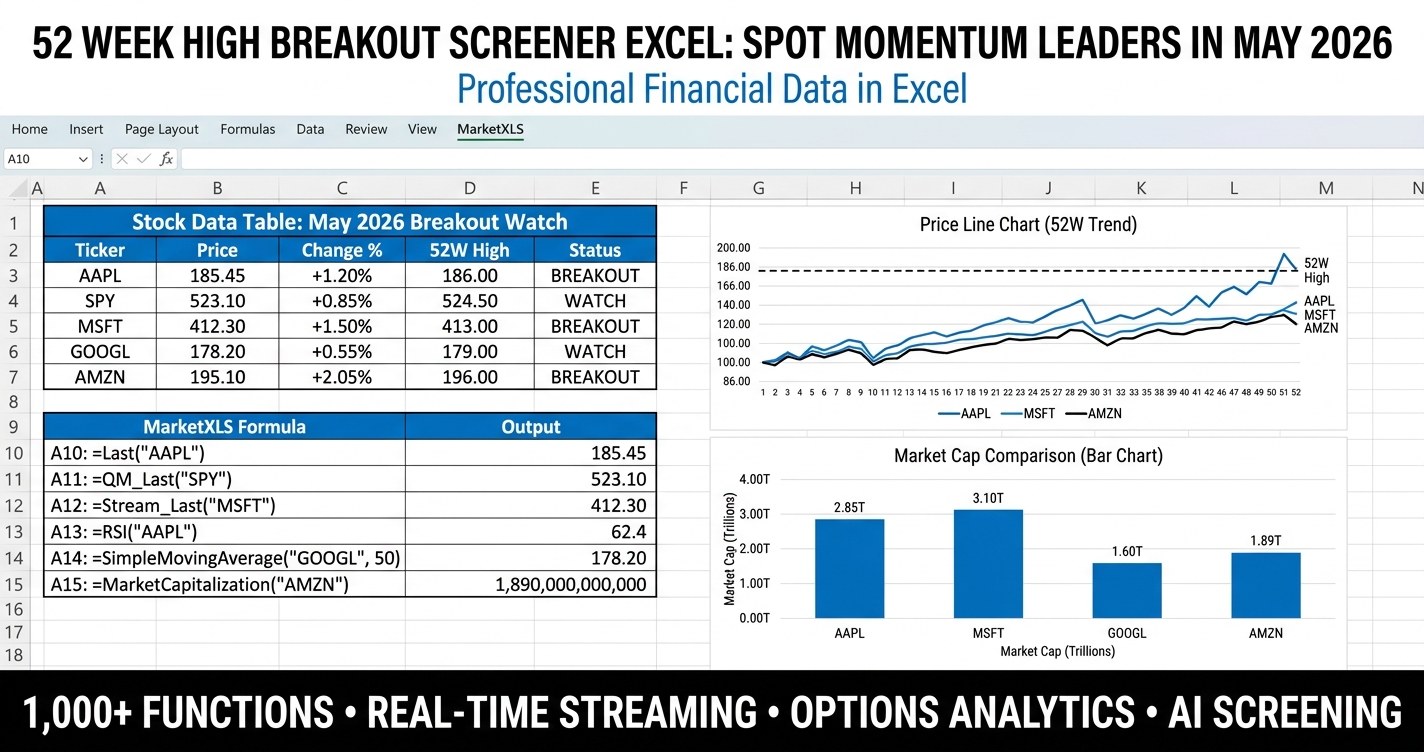
52 week high breakout screener excel - build a rules-based momentum watchlist that surfaces stocks pressing their 52-week highs with volume, RSI, and trend confirmation, powered by live MarketXLS formulas.
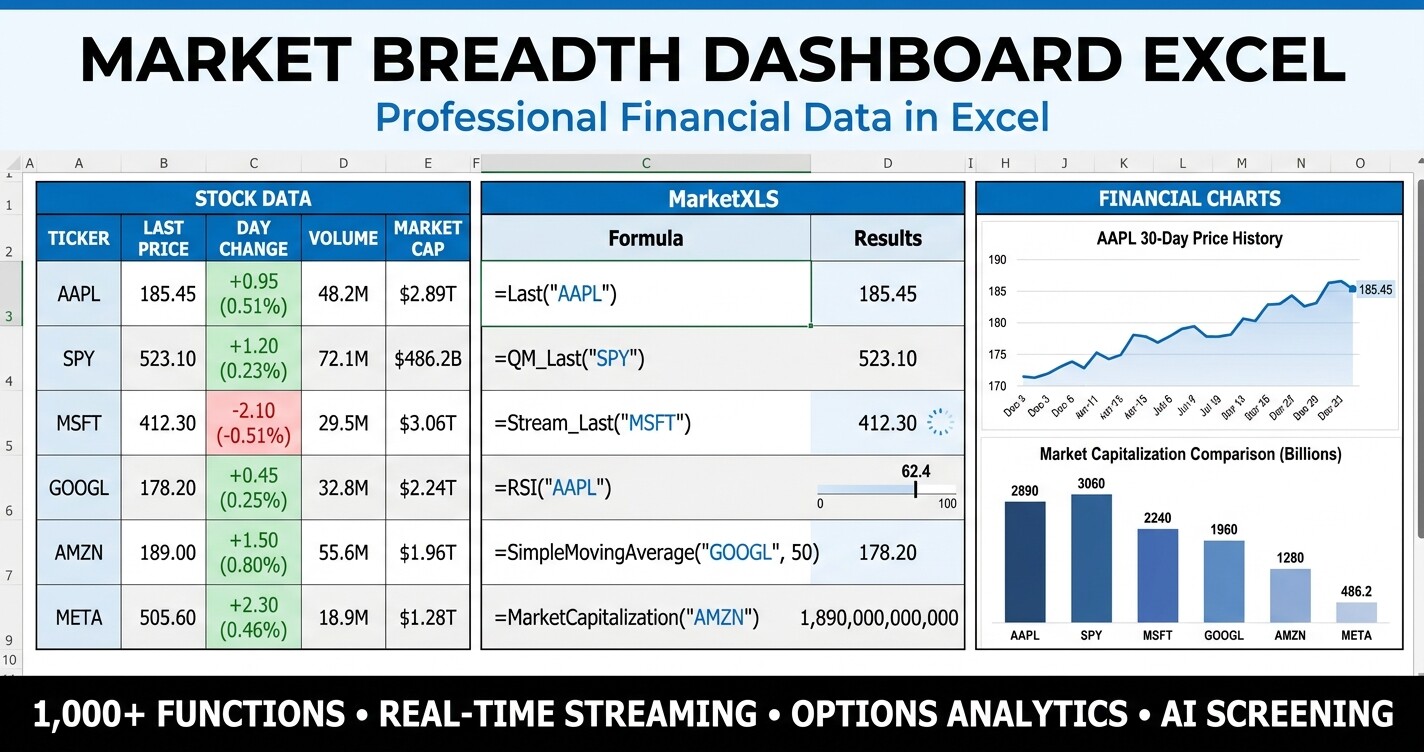
Market breadth dashboard Excel - track percent of stocks above the 50/200-day moving average, advance-decline counts, 52-week highs and lows, RSI distribution, and sector breadth in one premium workbook.
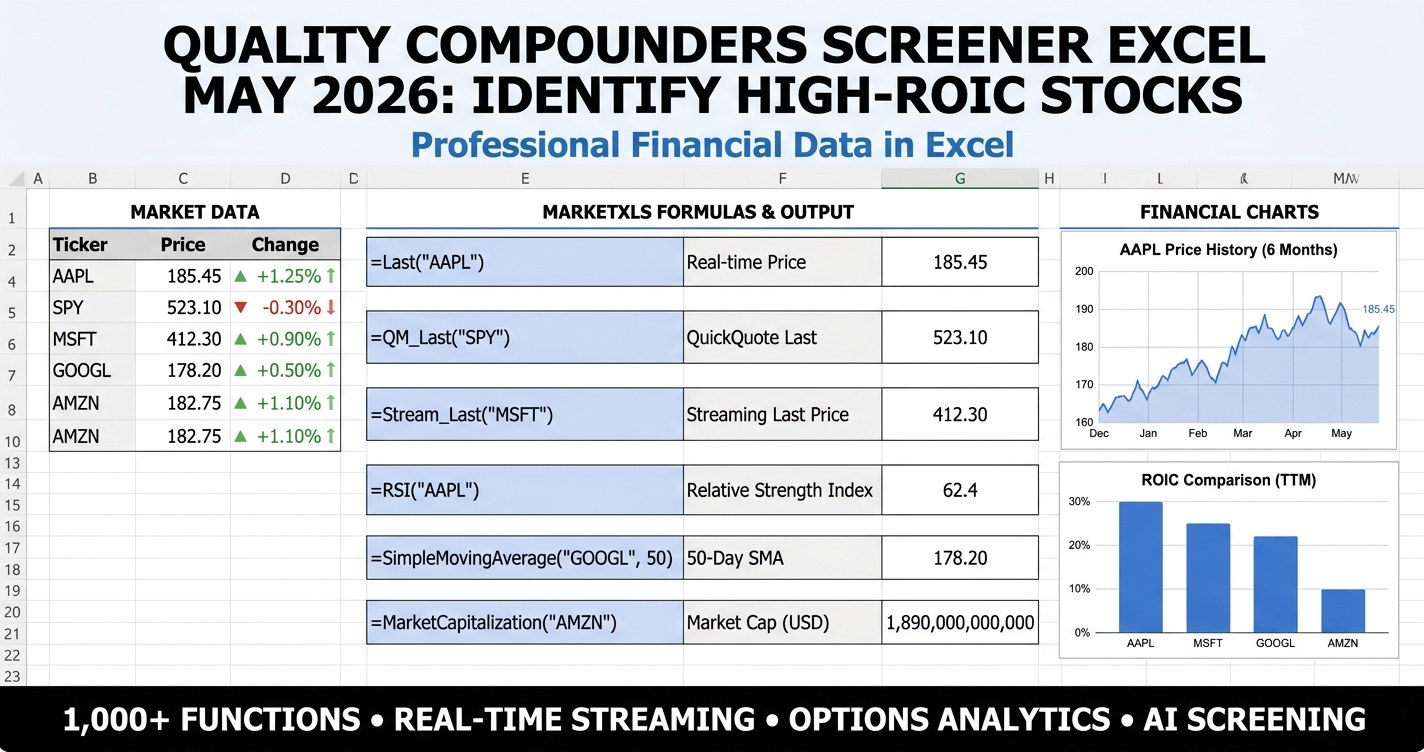
Quality compounders screener excel - download a May 2026 template that ranks 20 large-cap candidates on six compounder pillars (ROIC, ROE, operating margin, debt-to-equity, revenue growth, free cash flow) and surfaces high-conviction picks via a live MarketXLS scoring engine.
Live market data, stock screening, options analytics and portfolio management inside Excel.
MarketXLS Demo Video
Loading this content connects to its provider, which may use cookies or similar storage.