
Stock Analysis

In May 2022 MarketXLS launched a web stock screener: filter stocks by fundamental and technical rules, save screens, and send results to Excel.

Fibonacci retracement marks 23.6%, 38.2%, 50% and 61.8% pullback levels between a swing low and high. How the levels are calculated and how traders use them.

Buy stocks from Excel showing trade execution workflow and spreadsheet interface

AI in stock markets infographic showing sentiment analysis, algo trading, pattern recognition, and risk management

How machine learning is used in the stock market (forecasting, screening, portfolio risk, automated execution), its main limitations, and examples.

Small-cap stocks are companies worth roughly $300 million to $2 billion. How they compare with mid and large caps, their risks, and small-cap ETFs (data as of May 2021).

What the industrial sector includes, example industrial stocks and ETFs (XLI, VIS), the pros and cons of investing, and how to compare companies in Excel.

Overvalued stocks trade above their intrinsic value and can expose investors to significant downside risk. Learn how to identify overvalued stocks using valuation metrics, screening methods, and MarketXLS Excel formulas.
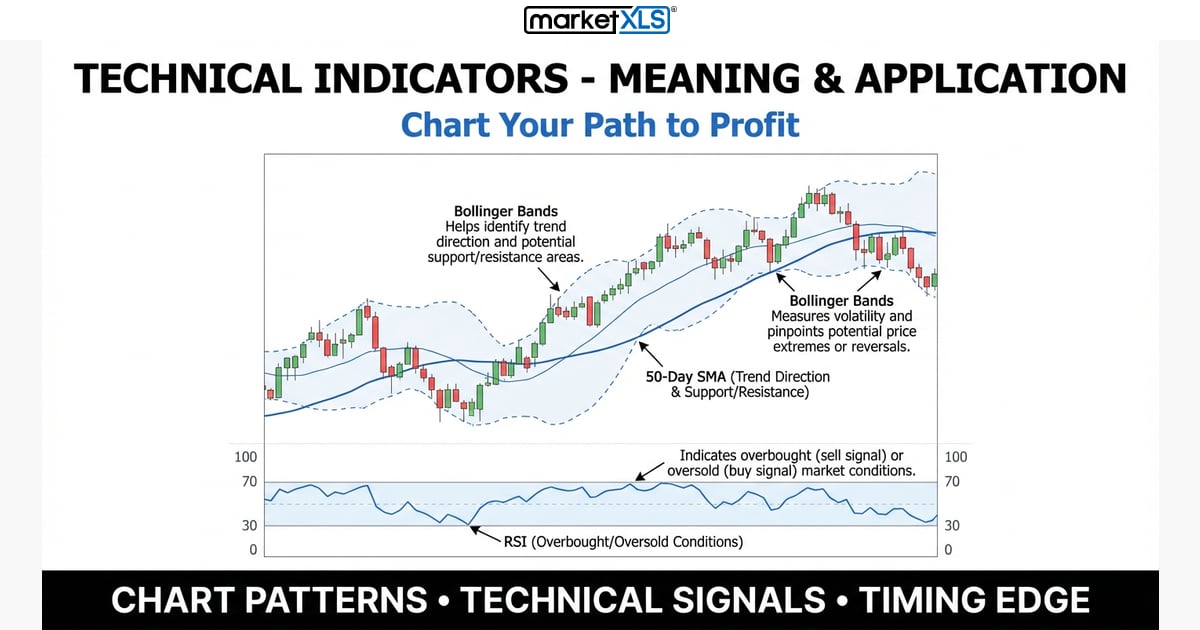
Technical indicators are formulas applied to past price and volume. What Bollinger Bands, SMA, EMA, golden and death crosses, MACD, and RSI measure and how traders read them.
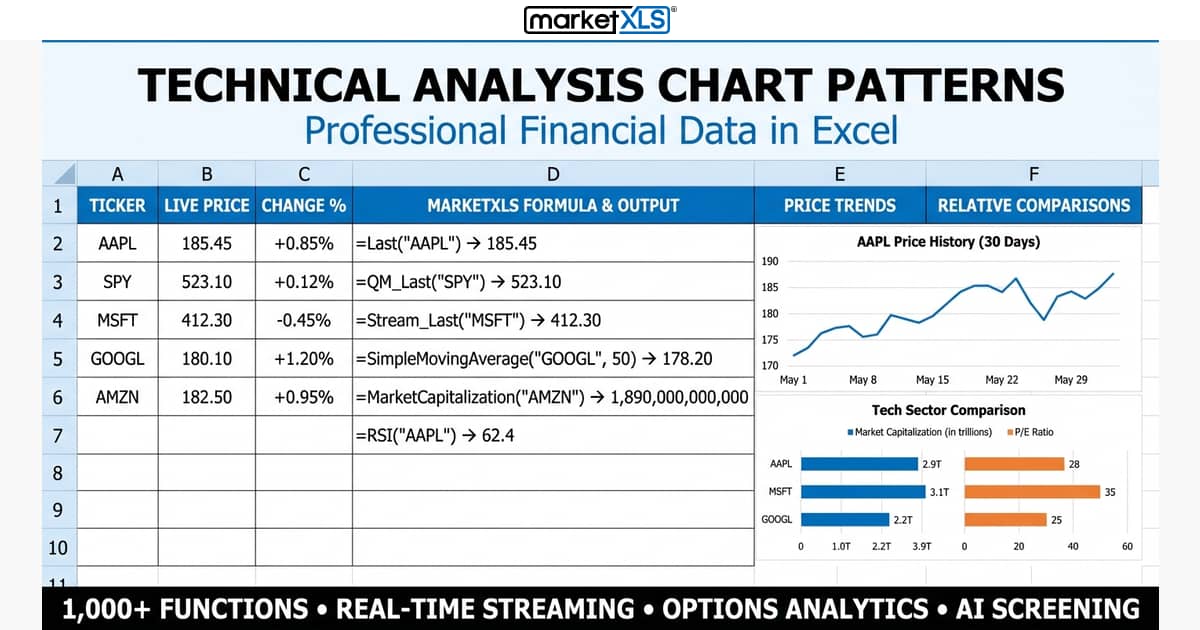
Chart patterns (head and shoulders, double tops, triangles, flags, candlesticks) and how to find, confirm, and backtest them in Excel with price history and RSI.

Consumer discretionary (cyclical) stocks sell non-essential goods and services, so they tend to rise and fall with the economy. Indicators to watch, sector ETFs, and risks.

What ESG investing means, how rating agencies such as MSCI score companies, and ten stocks with high ESG ratings as of June 2021.

Technical analysis studies past price and volume to judge where a stock may go next. A beginner guide to charts, candlesticks, trends, and support and resistance.

Three ways for US investors to buy Canadian stocks: interlisted shares on US exchanges, Canada ETFs such as EWC, and direct TSX purchases. Data as of 2021.

Ways for US investors to buy European stocks: ADRs, GDRs, ETFs, mutual funds and direct foreign accounts, plus notable names, ETFs and currency risk.
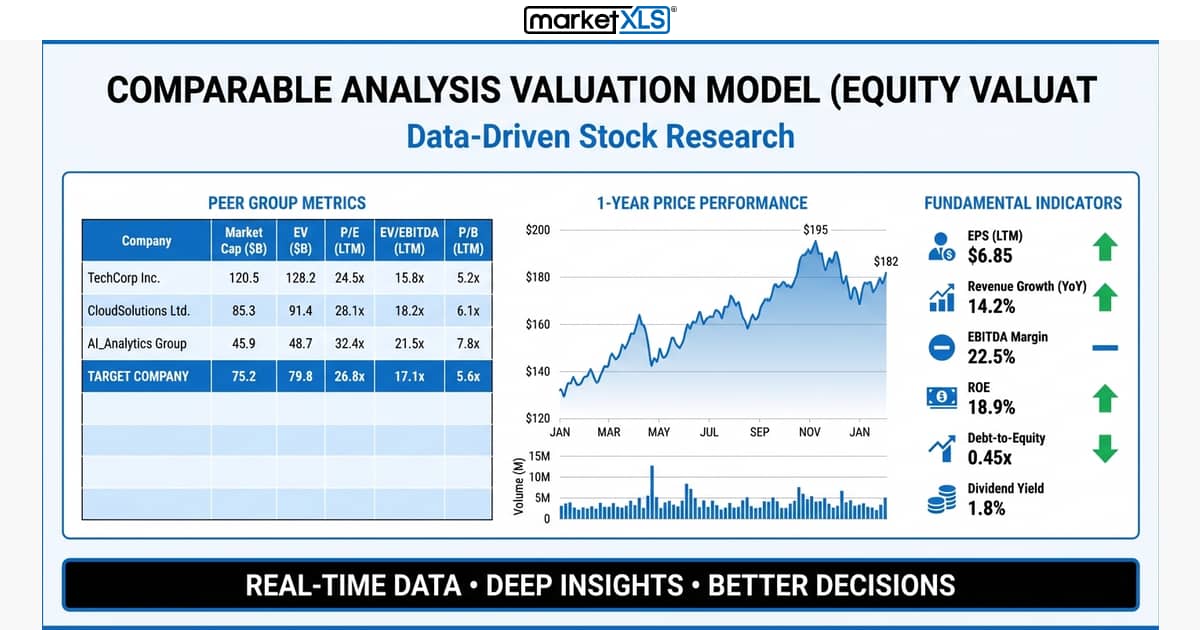
Comparable company analysis ("comps") values a company by comparing its valuation multiples, such as EV/EBITDA, EV/Revenue, and P/E, with those of similar companies in the same industry.