
Stock Analysis

Terminal value formulas for a DCF: the perpetuity growth (Gordon) method and the exit multiple method, with the Excel formulas for each.

Negative correlation means two securities tend to move in opposite directions. What causes it, how to measure it in Excel, and how investors use it to reduce portfolio risk.

The Dogs of the Dow strategy buys the 10 highest-yielding Dow stocks each year in equal amounts. How to pick them, review them, and track them in Excel.

Penny stocks under 10 cents mostly trade over the counter with thin volume, wide spreads, and high manipulation risk. What to check before buying and how to track them in Excel.

A technical stock screener filters stocks by price, volume and indicator rules such as moving averages and RSI. How to set criteria and review results.

Achieving High Yields with Penny Stocks and Dividends If youre an investor looking for higher yields than what the major markets offer, penny stocks may be just what youre looking for. Penny stocks, while they come with a risk and volatility, offer investors the potential for higher returns. Combined with dividend payouts, these small stocks */ -->

How to analyze a stock trend with historical prices: moving averages, support and resistance, and volatility, with the Excel formulas to do it.

How a dividend stock screener works, which criteria to use (yield, payout ratio, valuation), and how to build one in Excel with MarketXLS.

Bollinger Bands plot a band two standard deviations above and below a 20-day moving average. How to read them, their limits, and how to calculate them in Excel.

RSI (Relative Strength Index) is a 0 to 100 momentum indicator: above 70 is considered overbought, below 30 oversold. How it is calculated and how traders use it.

A dedicated stock trading and analysis platform replaces gut feel with data: faster research, consistent screening, and easier diversification.

Fibonacci retracement levels (23.6%, 38.2%, 50%, 61.8%) mark where a trending price may pull back before resuming. How to calculate and use them.
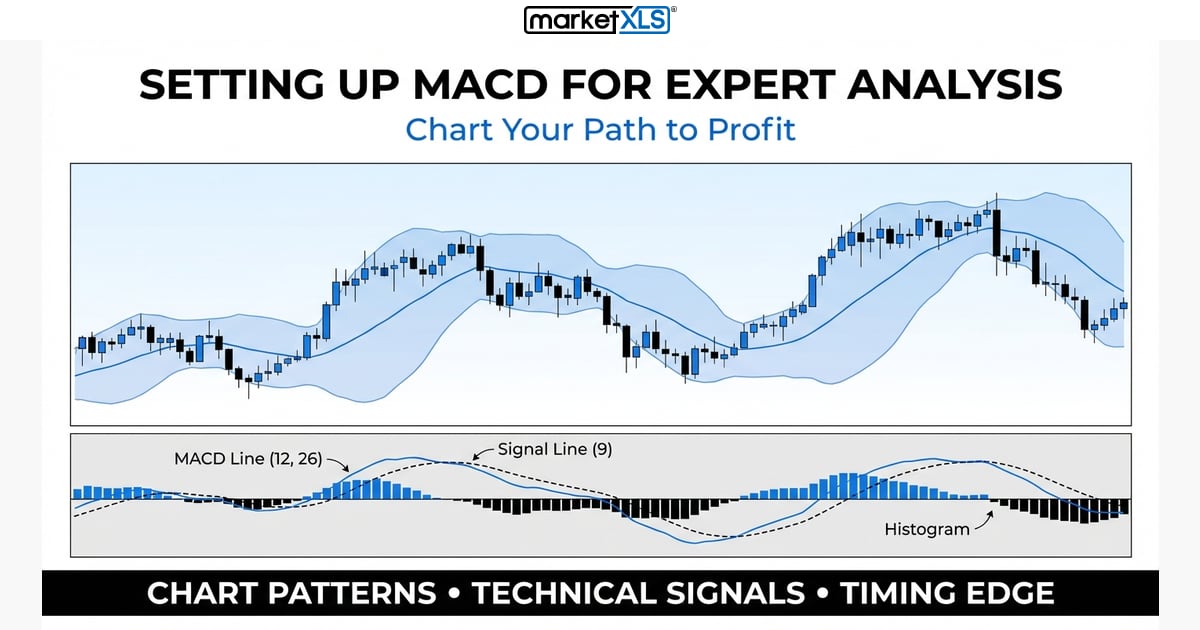
MACD is the 12-day EMA minus the 26-day EMA, with a 9-day EMA signal line. How to set it up, read crossovers and the histogram, and calculate it in Excel.

MACD is the 12-day EMA minus the 26-day EMA, with a 9-day EMA signal line. How to read crossovers, the histogram and divergence, and pull MACD into Excel.

IV rank compares current implied volatility to its high-low range; IV percentile shows the share of past days with lower IV. Get both in Excel with MarketXLS.

MarketXLS release 9.3.4.6 (May 2022) reorganized the Excel ribbon, added stock rank functions, and moved EarningsDate to a new data feed.