
Stock Analysis

Technical analysis timeliness is a MarketXLS template score that ranks stocks by their price relative to the 20, 50, and 200-day moving averages and RSI.

A stock health check-up scores a company on EPS trend, P/E versus peers, five-year growth, and profitability margins, using a MarketXLS Excel template.

Learn the difference between cyclical and non-cyclical stocks and how to determine the nature of a stock using MarketXLS.

Warren Buffett's top 10 Berkshire Hathaway holdings as of the December 31, 2020 13F (led by Apple and Bank of America), plus the value investing principles behind them. Check Berkshire's latest 13F for current holdings.
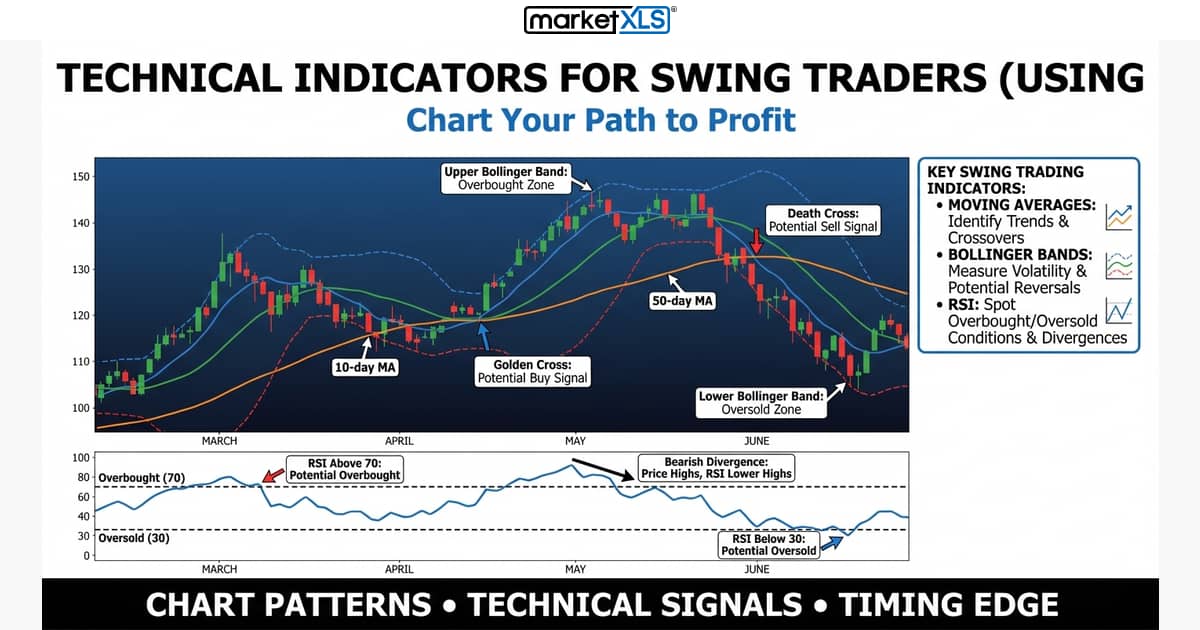
Common technical indicators for swing traders: moving averages, Bollinger Bands, RSI, stochastics, money flow index, MACD, and on-balance volume, and how to pull them into Excel.

Quantitative analysis of stocks uses financial ratios and statistics to compare companies. Two MarketXLS Excel templates score stocks on return, valuation and cash flow ratios.

Piotroski F-Score calculation and screening guide covering all 9 criteria, step-by-step Excel implementation, stock screening workflows, and practical ranking strategies using MarketXLS.

Four ways to invest in Indian stocks from abroad: Indian ADRs, India ETFs like INDA and INDY, an international broker with NSE access, or an Indian broker account.

US investors can buy Chinese stocks three ways: US-listed ADRs such as BABA and JD, China-focused ETFs, or a brokerage with access to Hong Kong and mainland exchanges. How each works and the main risks.

Drone stocks as of March 2021: AeroVironment, Boeing, EHang, Nvidia, and Amazon, with a MarketXLS WACC template to compare their cost of capital in Excel.

Virtual and augmented reality stocks as of March 2021: Meta (Facebook), Alphabet, Apple, Microsoft, Sony, Qualcomm, Snap and Nvidia, and their VR/AR businesses.
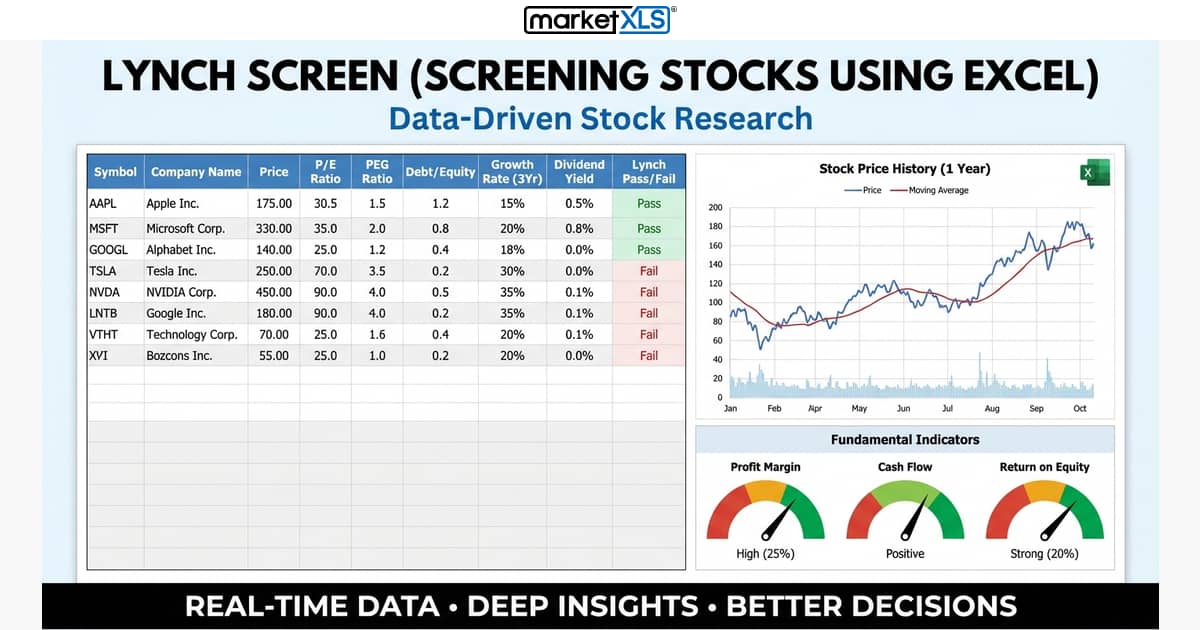
The Peter Lynch screen looks for profitable, low-debt companies growing earnings about 20% to 25% a year at a P/E no higher than that growth rate. Criteria and how to check a stock in Excel.

High volume stocks are the most heavily traded shares. Why volume matters for liquidity and trends, how to read volume with price, and how to find them in Excel.

Penny stocks trade under $5, are thinly traded, and swing sharply. Why they are volatile, the main risks, and how to list and track their volatility in Excel with MarketXLS.
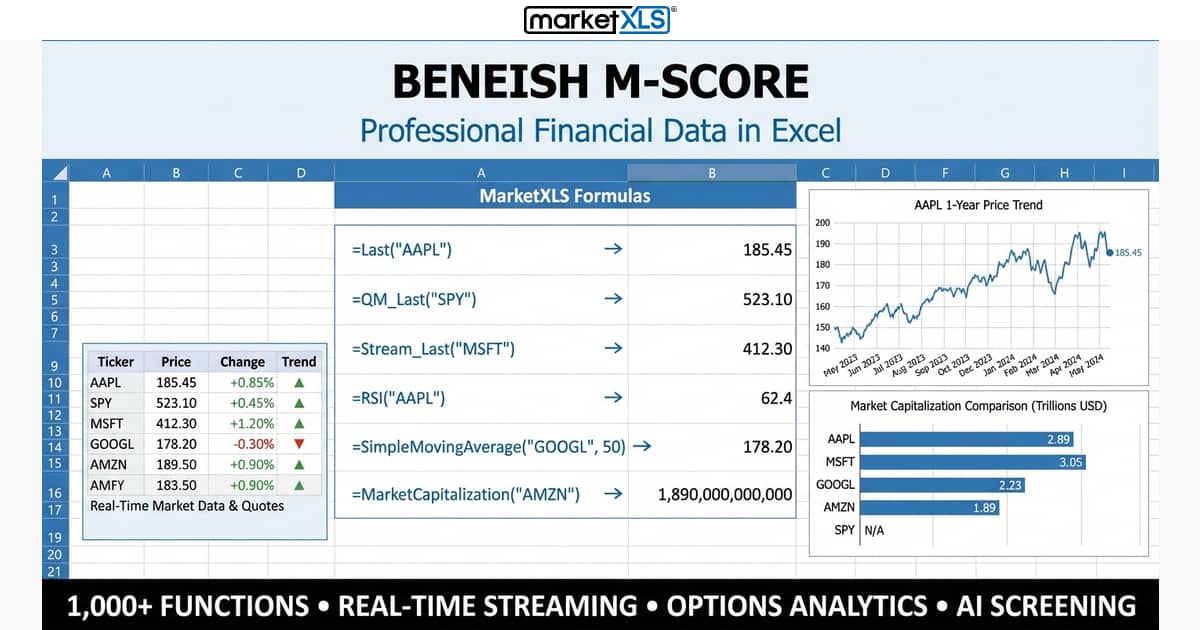
Beneish M-Score guide covering all 8 variables for detecting earnings manipulation, the complete formula, step-by-step Excel calculation, and screening strategies using MarketXLS.

Pharma penny stocks require thorough research and screening before investing. Learn how to analyze pharmaceutical small-cap stocks using MarketXLS formulas for fundamentals, revenue, and valuation.