
Stock Analysis

Gold penny stocks are sub-$5 gold miners whose profits move more than the gold price. How to screen them in Excel by price, market cap, volume, debt, and cash, plus the key risks.
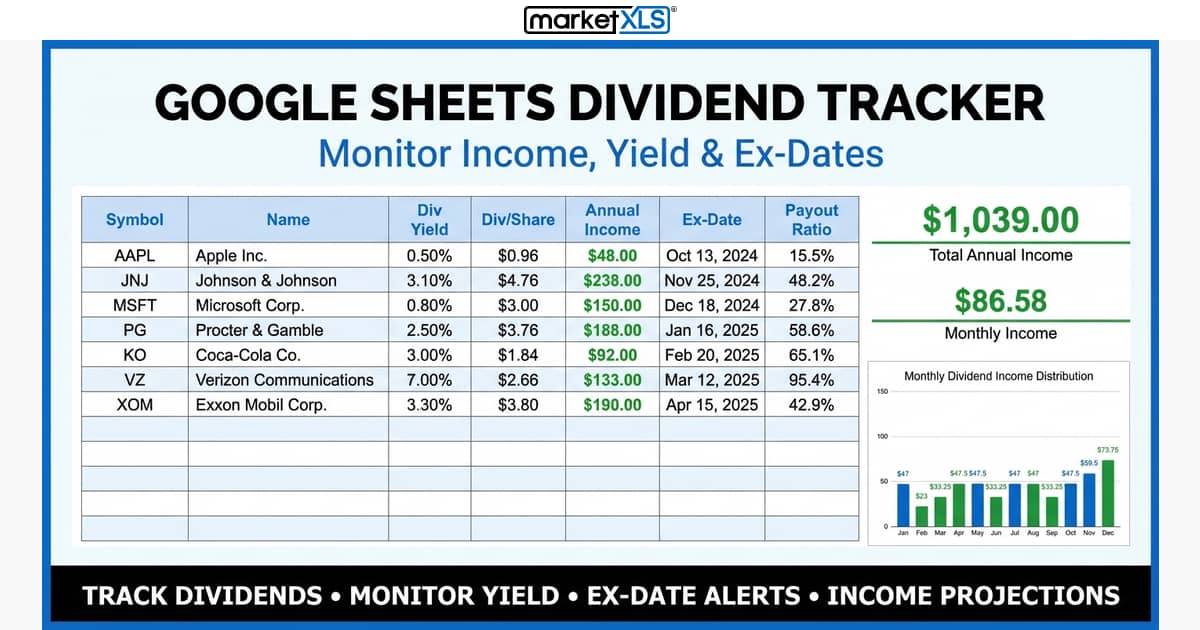
Build a dividend tracker in Google Sheets with MarketXLS. Monitor dividend yield, dividend per share, ex-dividend dates, payout ratios, and projected annual income for every stock in your portfolio.

Defense stocks screener excel — track and analyze aerospace, military, and defense sector stocks with live MarketXLS formulas during periods of heightened geopolitical risk.

A free Excel screener for 15 upstream, midstream, and downstream energy stocks with a 1-10 score, oil-price scenarios, and allocation sheets built on MarketXLS formulas.

Stock valuation calculator Excel — compare P/E ratios, dividend yields, market cap, RSI, and fair value scenarios across 10 stocks with this six-sheet valuation dashboard powered by live MarketXLS formulas.

Free quarterly earnings tracker for Excel: compare P/E, RSI, and trend, model EPS beat/miss scenarios, and size positions with MarketXLS formulas.

How to build a stock portfolio tracker in Excel: holdings table, live prices with MarketXLS formulas, P&L, dividends, sector allocation, benchmark and risk.
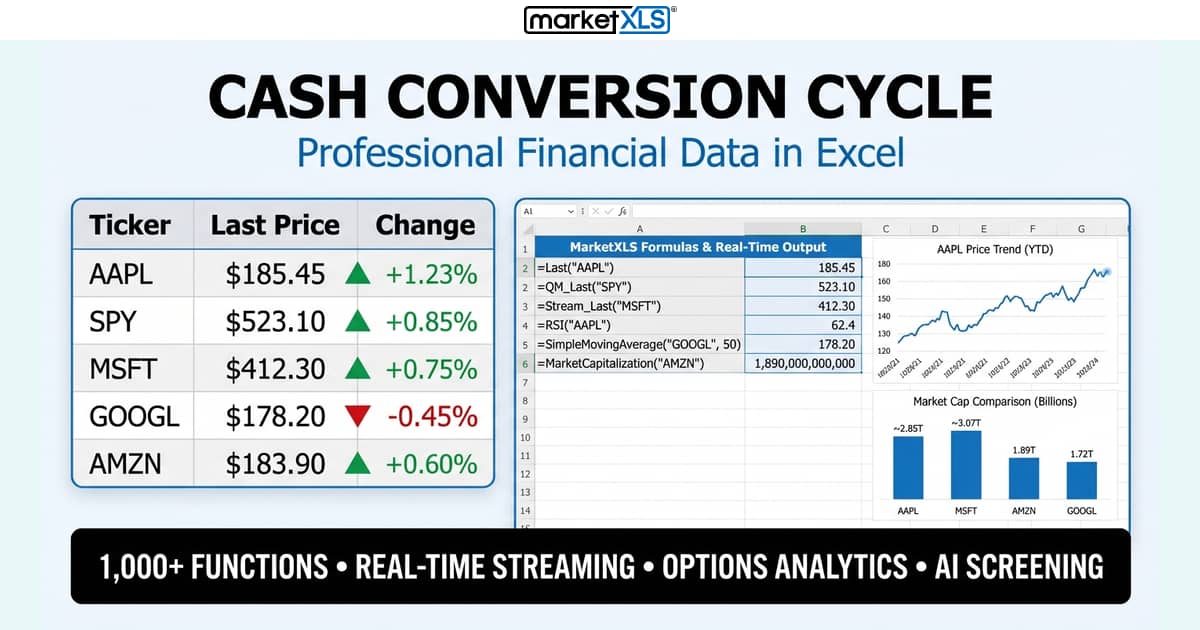
The cash conversion cycle (CCC = DIO + DSO - DPO) is the number of days between paying suppliers and collecting from customers. Formula, worked example, benchmarks, and Excel setup.

Find dividend yield in Google Sheets or Excel with =DividendYield("AAPL"), calculate it by hand, and screen for high-yield stocks while avoiding yield traps.

How to identify, screen, and analyze volatile penny stocks in Excel with MarketXLS: volatility metrics, screening criteria, and risk management.

A comparison of 8 Excel add-ins for stock data in 2026: real-time prices, options chains, fundamentals, Mac support, and who each one fits.

MarketXLS analyst and earnings functions: analyst count, price targets, EPS actual vs estimate and surprise, forward EPS estimates, with Excel examples.
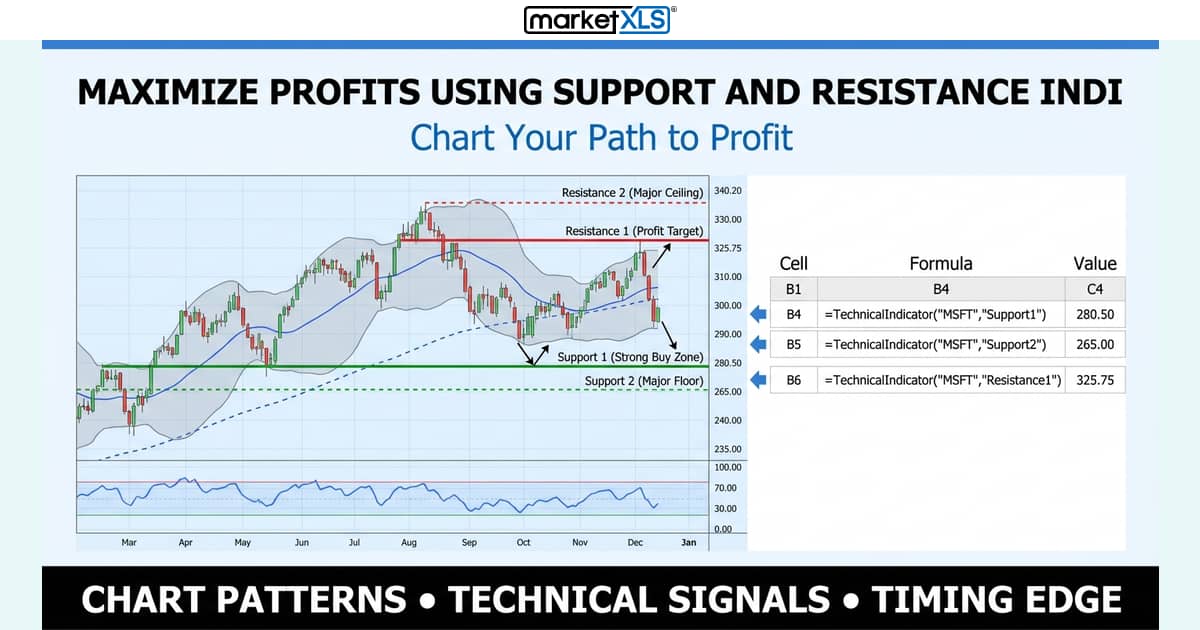
Support and resistance are price levels where a move tends to stall or reverse. How to find them, confirm them with volume and candlesticks, and calculate them in Excel.

Learn how to insert real-time stock prices in Excel using built-in features, external data sources, and MarketXLS. Complete guide with step-by-step instructions for tracking multiple stocks, setting alerts, and automating updates.

Preferred stock symbols use unique ticker conventions like .P and .PR suffixes. Learn how to identify, look up, and analyze preferred shares in Excel using MarketXLS functions for dividends, pricing, and fundamentals.

Real time market data providers vary widely in cost, coverage, and integration options — this guide compares the top providers to help traders and analysts choose the best fit for their needs.