
Stock Analysis

Five low-priced 5G telecom stocks analyzed in December 2020 (Vodacom, MTN, MTS, Turkcell, KPN), with their 5G rollout status and prices at the time.

Tech penny stocks are technology shares trading under $5. What to check before buying (EPS, P/E, sales growth, price-to-sales) and the liquidity and regulatory risks.

Dividend-paying penny stocks (under $5) are rare. How to find them in Excel with the MarketXLS stocks-under-$5 list and =DividendYield(), and what risks to check.

Penny stocks trade under $5 and are often illiquid. How to list stocks under $5 in Excel with MarketXLS and sort them by volume to find the most actively traded.

Stocks vs stock CFDs: buying a stock gives you ownership; a CFD is a leveraged contract with a broker on the price change. Compare shorting, leverage, costs and risks.

Stock volatility calculator methods explained for Excel. Learn historical vs implied volatility, annualizing returns, VIX analysis, and how to calculate volatility using MarketXLS functions.

To buy stocks online: open an account with a broker, choose common or preferred shares, decide how many shares to buy, and place a market or limit order.

A stock drawdown is the percentage fall from a peak to a later trough. How to calculate maximum drawdown and use MarketXLS drawdown functions in Excel.

Fundamental analysis of stocks explained with valuation ratios, financial statement analysis, key metrics, and step-by-step Excel tracking using MarketXLS formulas for PE ratio, revenue, market cap, and more.

Real estate stocks are shares of companies that own, operate, develop, or finance property, most commonly REITs. How REITs work and what to check before investing.

What to check before buying high yield dividend stocks (payout ratio, dividend growth, P/E, company size), plus a January 2019 list of high-yield large caps.

Monthly dividend stocks pay every month instead of quarterly. Three examples from 2017 (Realty Income, Main Street Capital, Gladstone Commercial) and how to check yields in Excel.
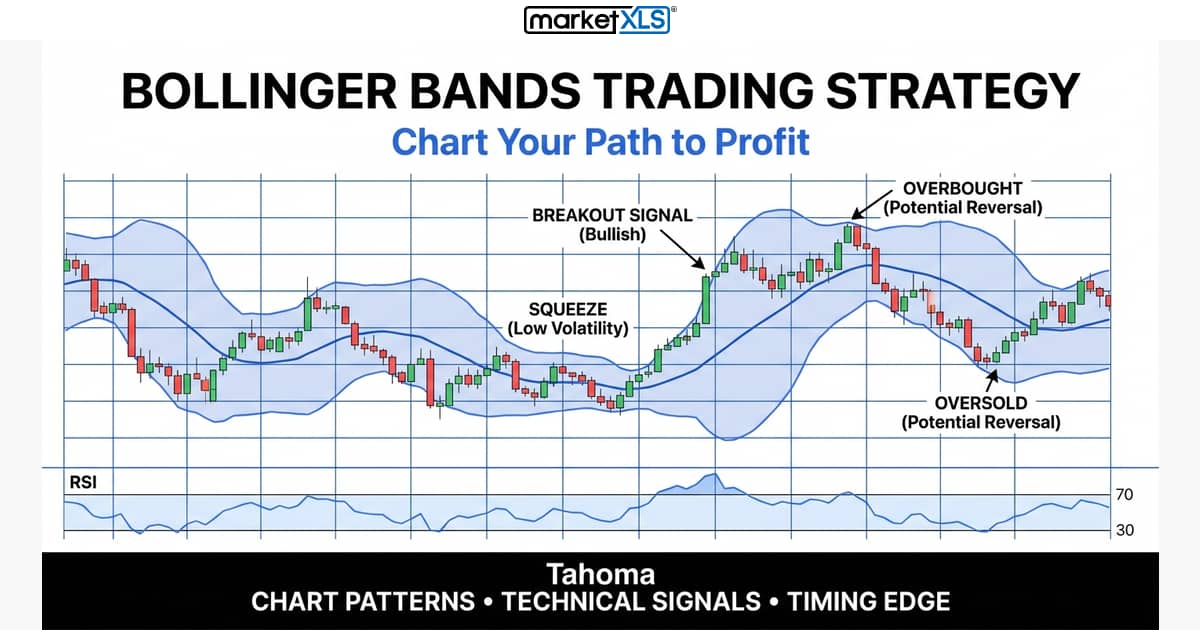
Bollinger Bands are a 20-day moving average with bands two standard deviations above and below it. Learn the squeeze, double bottom, and M top, and how to calculate them in Excel.

The dividend payout ratio is dividends per share divided by earnings per share. How to calculate and read it, with MarketXLS Excel formulas.

Margin of safety analysis compares a stock price with an estimate of value, here book value per share, to screen for shares the market may be underpricing, using Excel formulas.

An NCAV screener finds stocks priced below two-thirds of net current asset value (current assets minus total liabilities, per share), the Benjamin Graham deep value test.