
Stock Analysis

Stock Split Calculator Excel guide covering forward splits, reverse splits, cost basis adjustments, and how to track split history using formulas and MarketXLS functions.

Penny stocks under 10 Rs in the Indian market offer high risk and high potential reward. Learn how to screen, analyze, and evaluate these low-price shares using MarketXLS formulas and fundamental analysis.

S&P 500 on Google Finance uses the ticker .INX or INDEXSP:.INX. Learn how to find the S&P 500 live quote, pull it into Google Sheets, and why MarketXLS gives you deeper data with 1,000+ financial functions in Google Sheets and Excel.

Get a stock price on a specific date in Excel with STOCKHISTORY or MarketXLS Close_Historical, including weekend and holiday dates.

Live stock quotes in Excel: use =QM_Last for on-demand quotes or =QM_Stream_Last for streaming. Real-time needs the Advanced or Business plan; Standard is 15-min delayed.

Get NSE and BSE stock prices in Excel with the Stocks data type or MarketXLS India formulas, including historical data and live prices via Zerodha or Angel One.

Nifty 50 Stock List explained with full sector breakdown, company details, and how to track all 50 stocks in Excel using MarketXLS formulas for price, PE ratio, market cap, and dividend yield.
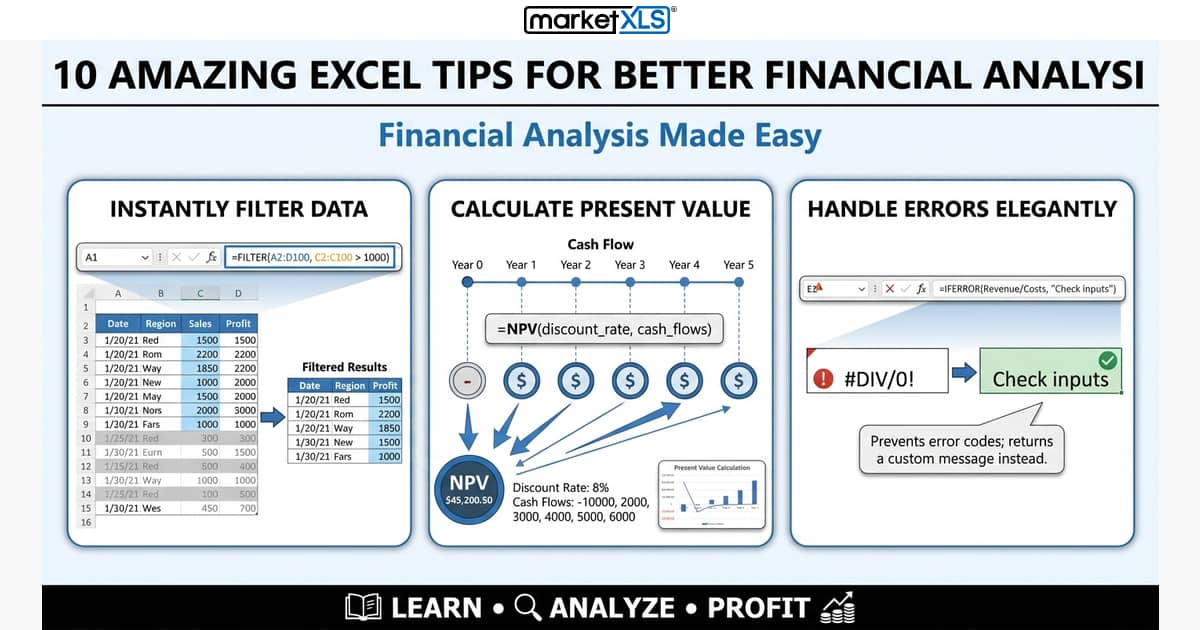
Ten Excel techniques for financial analysis: FILTER dynamic arrays, XLOOKUP, slicers, Power Query, data tables, conditional formatting, IFERROR, array formulas, named ranges, and VBA.

A balanced portfolio sets a stock/bond/cash mix from your risk tolerance and time horizon, caps single positions, and rebalances. Common rules and an Excel workflow.

Excel stock history formula options let you pull historical prices, calculate returns, and analyze trends directly in your spreadsheet. Learn every method with real formulas.

How the MarketXLS Excel add-in tracks stocks with formulas like =Last and =Volume, how it differs from Excel's built-in Stocks data type, and how to set it up.

A stock data Excel add-in adds formulas like =Last("AAPL") that pull quotes, historical prices, fundamentals, and options chains into Excel cells.

Covariance measures how two stocks move together. How to calculate it in Excel with COVARIANCE.S, read the sign, and use it to diversify.
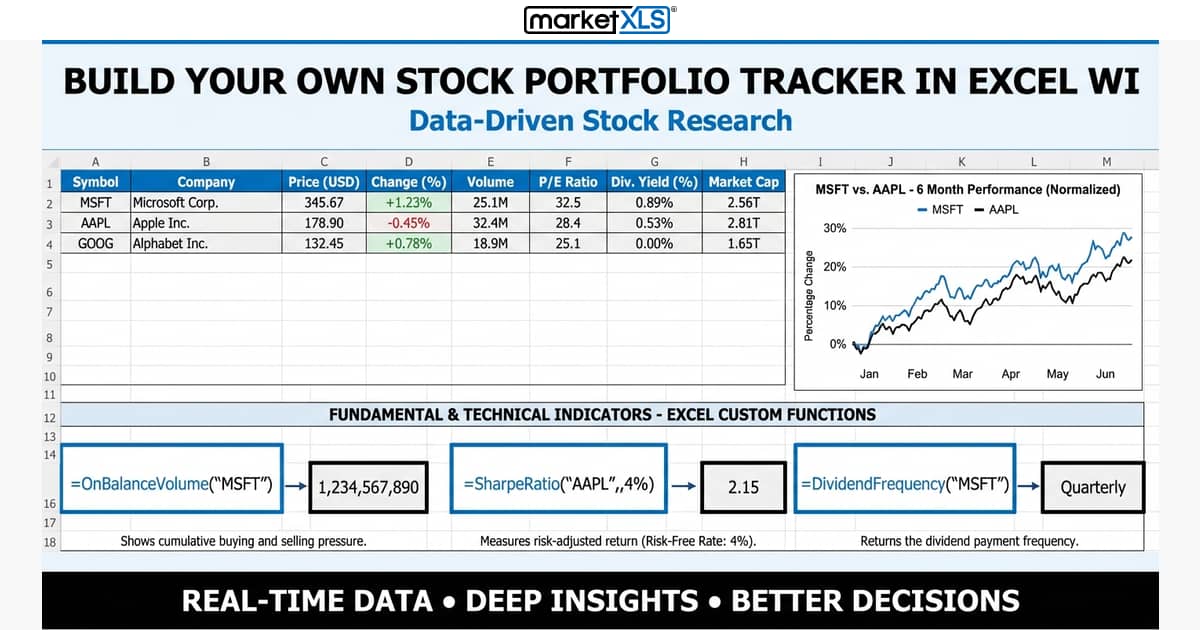
How to build a stock portfolio tracker in Excel: list your holdings, pull prices with MarketXLS formulas like =Last("AAPL"), and calculate value, gain, and return.

To get the next dividend you must buy a stock before its ex-dividend date. Pull ex-dates, pay dates, and yields for many stocks into Excel with MarketXLS formulas.

Get historical stock prices for many tickers in Excel with MarketXLS: =QM_GetHistory for a full price table, or =Close_Historical(ticker, date) for one date per cell.