

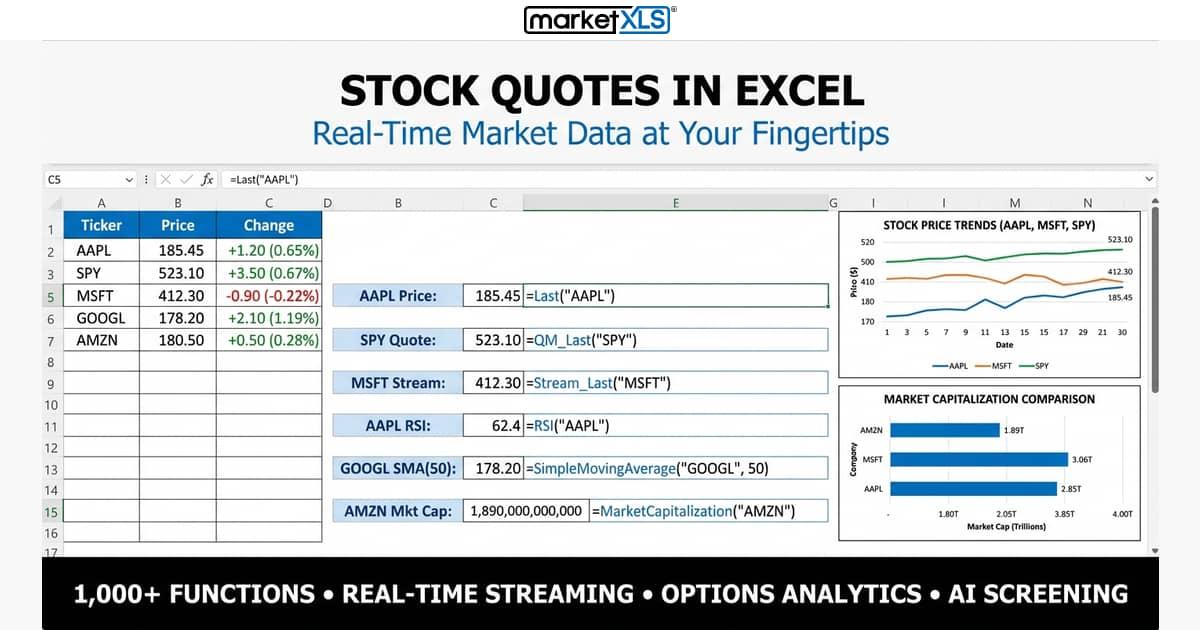
To get stock quotes in Excel, you can use Excel 365's free Stocks data type and STOCKHISTORY function (delayed prices, no options), Power Query web imports, or an add-in such as MarketXLS, where =Last("AAPL") returns the latest price in a cell and =QM_Stream_Last("AAPL") streams it. MarketXLS quotes come from QuoteMedia and are 15-minute delayed on the Standard plan and real-time on the Advanced and Business plans. This guide compares five methods on real-time data, fundamentals, options coverage, and cost.
If you already know you want an Excel-native product path, start with the canonical stock quotes in Excel page for formulas, plan guidance, and related workflows.
Methods Compared: Getting Stock Quotes Into Excel
The five methods compare as follows:
| Method | Real-Time | Fundamentals | Options | Cost | Best For |
|---|---|---|---|---|---|
| STOCKHISTORY Function | No (delayed) | No | No | Free (Excel 365) | Basic historical prices |
| STOCK Data Type | No (delayed) | Limited | No | Free (Excel 365) | Quick lookups |
| Power Query | No | No | No | Free | One-off data pulls |
| Google Sheets GOOGLEFINANCE | No (delayed) | Limited | No | Free | Google ecosystem users |
| Python/VBA Scripts | Varies | Varies | Varies | Free (+ dev time) | Developers |
| MarketXLS | Yes on Advanced/Business (Standard: 15-min delayed) | 1000+ formulas | Chains + Greeks | From $70/month (annual) | Advisors and active investors |
Method 1: Microsoft's Built-In STOCKHISTORY Function
Excel 365 introduced the STOCKHISTORY function, which pulls historical price data directly into your spreadsheet without any add-ins.
Step-by-Step
- Open Excel 365 (this function is not available in older Excel versions)
- In any cell, type:
=STOCKHISTORY("AAPL", "1/1/2025", "12/31/2025") - The function returns a spill range with dates and closing prices
- You can add optional parameters for interval (daily, weekly, monthly) and specific data points (open, high, low, close, volume)
Limitations
While STOCKHISTORY is free and convenient, it falls short for professional use:
- No real-time data: prices are delayed by at least 15-20 minutes and often more
- Historical only: there's no equivalent function for getting the current live price
- Limited metrics: only price and volume data; no P/E ratios, dividend yields, market cap, or other fundamentals
- No options data: zero support for options chains, Greeks, or option pricing
- Limited coverage: primarily US equities; sparse coverage of international markets, futures, or crypto
- No streaming: data is static until you manually recalculate
For a financial advisor building client reports or an asset manager running portfolio analytics, these limitations make STOCKHISTORY a non-starter for anything beyond basic charting.
Method 2: Microsoft STOCK Data Type
Excel 365 also offers the STOCK data type, which converts a ticker symbol into a rich data card with basic financial information.
Step-by-Step
- Type a ticker symbol (e.g., "AAPL") in a cell
- Select the cell and go to Data → Stocks in the ribbon
- Excel converts the text to a STOCK data type with an icon
- Click the icon to see available fields, or use dot notation:
=A1.Price,=A1.PE,=A1.MarketCap
Limitations
- Delayed data: prices are not real-time, typically 15-30 minutes behind
- Limited fields: only a handful of metrics available compared to what professionals need
- Manual refresh: you must trigger updates manually or set auto-refresh intervals
- No historical data: the data type shows current snapshots only
- No options support: no options chains, Greeks, or derivatives data
- No technical indicators: no RSI, moving averages, or other technical analysis tools
- Unreliable resolution: Excel sometimes fails to recognize tickers or maps them incorrectly
The STOCK data type works for someone who occasionally checks a price. It doesn't work for someone who manages portfolios or builds financial models.
Method 3: Power Query Web Connections
Power Query is Excel's built-in data transformation engine. It can connect to web pages and pull structured data into your spreadsheet.
Step-by-Step
- Go to Data → Get Data → From Web
- Enter a URL that displays stock data in a table format
- Power Query detects tables on the page and lets you select one
- Transform the data as needed (filter columns, change types)
- Load the results into your spreadsheet
Limitations
- Fragile connections: when the source website changes its layout (which happens frequently), your query breaks and requires manual repair
- No real-time updates: data refreshes only when you trigger it
- Rate limiting: frequent requests may get blocked by the source website
- Maintenance burden: someone on your team needs to fix broken queries regularly
- No streaming: impossible to get continuously updating prices
- Complex setup: each data point requires its own query configuration
Power Query is powerful for one-off data imports, but it's not a sustainable solution for daily professional workflows that require reliable, always-on market data.
Method 4: Google Sheets GOOGLEFINANCE
If you're willing to work outside of Excel, Google Sheets offers the GOOGLEFINANCE function for basic stock data.
Step-by-Step
- Open Google Sheets
- Type
=GOOGLEFINANCE("AAPL")for the current price - Use
=GOOGLEFINANCE("AAPL", "pe")for the P/E ratio - Use
=GOOGLEFINANCE("AAPL", "close", "1/1/2025", "12/31/2025")for historical data
Limitations
- Not Excel: this only works in Google Sheets, so if your models and workflows are built in Excel, this is a dead end
- Delayed data: prices are delayed by at least 15-20 minutes
- Limited metrics: only basic price data and a handful of fundamentals
- No options data: zero support for options chains or derivatives
- No technical indicators: no built-in RSI, SMA, or other technical analysis
- Reliability issues: GOOGLEFINANCE occasionally returns errors or stale data without warning
- No professional support: if something breaks, there's no one to call
Google Sheets works for personal investing or casual research. For deeper data in Sheets, MarketXLS also has a Google Sheets add-on at the same pricing as the Excel version.
Method 5: The Formula Approach, MarketXLS
MarketXLS is an Excel add-in with 1000+ financial functions that you type as standard Excel formulas, with no coding or web queries.
Getting Started
- Install MarketXLS: the Windows desktop add-in (ribbon tab "MarketXLS", activated with a license key) or the Microsoft 365 add-in from Microsoft AppSource for Excel on Mac and Excel for the web (ribbon "MarketXLS (Web)", sign in with your MarketXLS account). See choose your version.
- Confirm the MarketXLS tab appears in your ribbon.
- Type formulas. In the Microsoft 365 add-in, prefix them with
mxls., for example=mxls.Last("MSFT").
Current Stock Price
The most basic need, getting a current stock quote, takes one formula:
=Last("AAPL")
=Last("AAPL") and =QM_Last("AAPL") return an on-demand snapshot that updates when Excel recalculates. For streaming prices that update automatically while streaming is on:
=QM_Stream_Last("AAPL")
Streaming uses one live symbol subscription per unique symbol. Stock quotes are 15-minute delayed on the Standard plan and real-time on Advanced and Business. Coverage includes US, Canadian, UK, German, and Australian markets (ASX live data needs an additional Barchart subscription).
Historical Stock Data
=QM_GetHistory("AAPL") returns historical OHLCV (open, high, low, close, volume) data that spills into adjacent cells. In the Microsoft 365 add-in, getHistory also takes a date range and periodicity:
=GetHistory("AAPL", "2025-01-01", "2025-12-31", "daily")
Fundamental Data
MarketXLS returns fundamentals as formulas:
- P/E Ratio:
=PERatio("AAPL") - Market Capitalization:
=MarketCapitalization("AAPL") - Revenue:
=Revenue("AAPL") - Dividend Yield:
=DividendYield("AAPL") - Dividend Per Share:
=DividendPerShare("AAPL") - Dividend Frequency:
=DividendFrequency("AAPL")
Put one ticker per row and one metric per column, and the sheet becomes a screener that refreshes on recalculation.
Technical Indicators
For technical analysis, MarketXLS provides indicators as formulas:
- 50-Day Simple Moving Average:
=SimpleMovingAverage("AAPL", 50) - 200-Day Simple Moving Average:
=SimpleMovingAverage("AAPL", 200) - Relative Strength Index:
=RSI("AAPL")
You can combine these with Excel's conditional formatting to build visual dashboards that highlight overbought or oversold conditions, moving average crossovers, and trend signals, all without leaving Excel.
Options Data
=QM_GetOptionChain("AAPL") returns option chain data in Excel:
=QM_GetOptionChain("AAPL")
The chain includes expirations, strikes, bid, ask, volume, open interest, and Greeks. Options data is end-of-day on the Standard plan and real-time on Advanced and Business. You can also construct specific option symbols:
=OptionSymbol("AAPL", "2026-03-21", "C", 200)
This returns @AAPL 260321C00200000, which you can then use to get the option's current price:
=QM_Last("@AAPL 260321C00200000")
None of the free methods above return options data.
Building a Professional Stock Dashboard
Let's put these formulas together into something practical. Here's how a financial advisor might build a portfolio monitoring dashboard:
Portfolio Overview Section
Set up your tickers in column A, then use formulas across each row:
- Column A: Ticker (AAPL, MSFT, GOOGL, JPM, JNJ)
- Column B: Current Price:
=Last("AAPL") - Column C: P/E Ratio:
=PERatio("AAPL") - Column D: Market Cap:
=MarketCapitalization("AAPL") - Column E: Dividend Yield:
=DividendYield("AAPL") - Column F: RSI:
=RSI("AAPL") - Column G: 50-Day SMA:
=SimpleMovingAverage("AAPL", 50)
If Column B uses =QM_Stream_Last() (Advanced or Business plan), it updates in real time; the other columns refresh when Excel recalculates. Add conditional formatting to highlight stocks trading below their 50-day moving average or with RSI below 30.
Before you send a dashboard like this to a client, it's worth confirming every quote was actually live when you exported it. Our dedicated walkthrough, Stock Quotes in Excel: build a self-auditing quote board, shows how to flag stale, wide, or thin quotes automatically so a delayed price never slips into a report.
Sector Comparison
Build a sector analysis by pulling the same metrics for sector ETFs:
=Last("XLF"): Financials=Last("XLK"): Technology=Last("XLV"): Healthcare=Last("XLE"): Energy=Last("XLI"): Industrials
Compare =DividendYield("XLF") across sectors to identify income opportunities, or track =RSI("XLK") to spot sector rotation signals.
Client Reporting
For wealth managers and financial advisors, the ability to build client-specific dashboards in Excel means you can customize every report to each client's holdings, risk tolerance, and investment objectives. Pull real-time data with MarketXLS formulas, run your analysis in Excel, and deliver professional reports, all without switching between multiple platforms.
Pro Tips for Working With Stock Quotes in Excel
Tip 1: Use Named Ranges for Clean Formulas
Instead of hardcoding ticker symbols, use Excel's named ranges. Name cell A2 as "Ticker" and reference it in your formulas: =Last(Ticker). This makes your models flexible and reusable across different securities.
Tip 2: Combine With Excel's Built-In Tools
MarketXLS formulas return standard Excel values, which means you can use them with VLOOKUP, INDEX/MATCH, pivot tables, charts, and conditional formatting. Build complex models using familiar Excel functions while MarketXLS handles the data feed.
Tip 3: Set Up Watchlists With Streaming
For active monitoring, use =QM_Stream_Last("AAPL") for the symbols you watch closely. Streaming formulas update automatically while streaming is on. Each unique symbol uses one live subscription, so keep large lists on-demand.
Tip 4: Historical Analysis for Due Diligence
When evaluating a new position, pull historical data with =QM_GetHistory("AAPL") and use Excel's charting tools to visualize price trends, calculate returns, and assess volatility, all within your existing workflow.
Tip 5: Build Reusable Templates
Create template workbooks with MarketXLS formulas that reference a single "ticker input" cell. Change the ticker and the fundamentals, technicals, historical data, and options chain all update. Share these templates across your team to standardize analysis workflows.
Who Benefits Most From Stock Quotes in Excel?
Financial Advisors
Financial advisors manage multiple client portfolios, each with different holdings and objectives. Having stock quotes flow directly into Excel means you can build customized monitoring dashboards, run performance attribution analysis, and generate client reports without toggling between platforms. See MarketXLS portfolio analytics tools.
Asset Managers
Asset managers need depth, fundamental screening, technical signals, options strategies, and risk metrics. MarketXLS delivers all of this as Excel formulas, letting you build proprietary models that stay within your existing infrastructure. The options analytics suite provides full chain data, Greeks, and profit/loss modeling.
Wealth Managers and Family Offices
Wealth managers overseeing diverse portfolios need one data source across asset types. MarketXLS covers US equities, international markets (Canada, UK, Germany, Australia), ETFs, mutual funds, options, and crypto. See all available functions to explore the full data coverage.
Quantitative Analysts
Quant analysts building factor models, backtesting strategies, or running statistical analysis need bulk historical data and clean fundamental inputs. MarketXLS =QM_GetHistory() and the 1000+ function library provide inputs for quantitative research, and VBA can call MarketXLS functions.
Pricing: What Does Professional Stock Data Cost?
Different methods come at different price points:
- Microsoft STOCKHISTORY / STOCK Data Type: Free with Excel 365 subscription. Limited data, delayed quotes, no options or technicals.
- Google Sheets GOOGLEFINANCE: Free. Even more limited than Microsoft's tools. Not Excel.
- Power Query: Free but costs significant time in maintenance and troubleshooting.
- MarketXLS: US non-professional plans are Standard ($70/month billed annually; 15-minute delayed stocks, end-of-day options), Advanced ($125/month billed annually; real-time streaming stocks and options), and Business ($200/month billed annually; adds real-time forex and indices). Quarterly billing is available at a higher monthly rate. Prices include data and exchange fees; taxes may apply. See current pricing.
Frequently Asked Questions
How do I get real-time stock quotes in Excel?
Use an Excel add-in such as MarketXLS. =QM_Stream_Last("AAPL") streams the price into a cell and updates automatically while streaming is on. Real-time US stock quotes require the Advanced or Business plan; the Standard plan is 15-minute delayed. Microsoft's built-in Stocks data type and STOCKHISTORY provide delayed data only.
Can I get stock quotes in Excel without an add-in?
Yes, but with significant limitations. Excel 365 offers the STOCKHISTORY function for historical data and the STOCK data type for basic current data. Both provide delayed quotes with limited metrics. For real-time prices, comprehensive fundamentals, technical indicators, or options data, you'll need a professional add-in like MarketXLS.
What stock data can I pull into Excel with MarketXLS?
MarketXLS provides 1000+ Excel functions covering current and streaming prices (=Last(), =QM_Stream_Last()), historical data (=QM_GetHistory()), fundamentals (=PERatio(), =MarketCapitalization(), =Revenue(), =DividendYield()), technical indicators (=SimpleMovingAverage(), =RSI()), and full options chains with Greeks (=QM_GetOptionChain()). Data coverage includes US equities, Canadian, UK, German, and Australian markets, ETFs, mutual funds, options, and crypto.
Is Excel a good tool for tracking stock portfolios?
Yes. Excel is flexible enough to model any portfolio layout, and with a data add-in such as MarketXLS the prices and fundamentals refresh in place. You can build custom dashboards, run risk analysis, track performance metrics, and generate client reports, all within the spreadsheet environment you already master.
How often do stock quotes update in Excel with MarketXLS?
It depends on the formula you use. Standard formulas like =Last("AAPL") update when you refresh your workbook. Streaming formulas like =QM_Stream_Last("AAPL") update automatically while streaming is on (real-time on the Advanced and Business plans). You control which cells stream and which remain static, so you can balance real-time monitoring with workbook performance.
Does MarketXLS work with Excel on Mac?
Yes. On Mac, use the MarketXLS Microsoft 365 add-in, installed from Microsoft AppSource, which also runs in Excel for the web. It adds a "MarketXLS (Web)" ribbon and task pane, signs in with your MarketXLS account, and uses the mxls. prefix (for example =mxls.Last("MSFT")). Some functions differ from the Windows desktop add-in; check /formulas for platform support.
The Bottom Line
Free methods like STOCKHISTORY and the Stocks data type cover delayed prices and basic fields. For real-time streaming, fundamentals, technical indicators, and options chains in cell formulas, MarketXLS adds 1000+ functions to Excel on Windows, Mac (Microsoft 365 add-in), and the web, plus Google Sheets. Real-time data requires the Advanced or Business plan.
Use the StockDataInExcel quote-board guide to add timestamp, spread, liquidity and range checks to the worksheet.
