A firm’s Weighted Average Cost of Capital (WACC) represents its blended cost of capital across all sources, including common shares, preferred shares, and debt. The cost of each type of capital is weighted by its percentage of total capital and they are added together. In this article, we will try to understand what is WACC, when to use it and how to use it using MarketXLS.
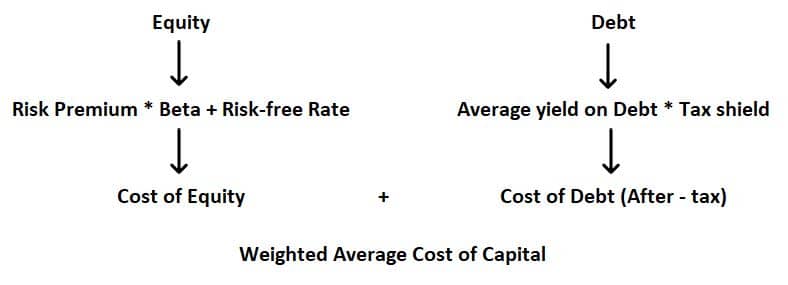
The formula for WACC is:
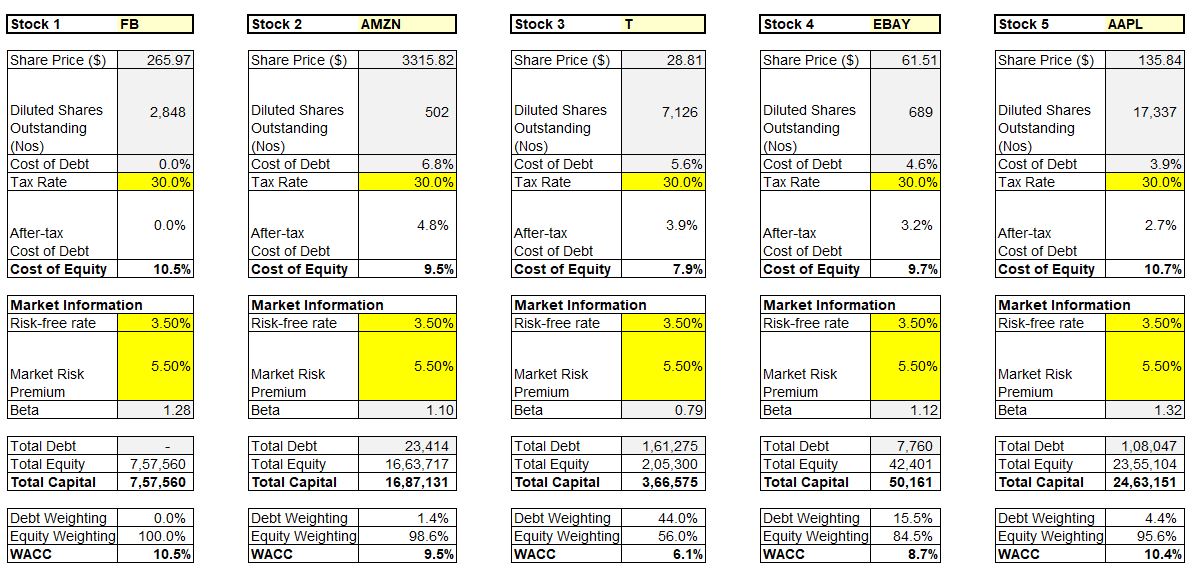
WACC = Cost of Equity (Equity / (Debt + Equity)) + Cost of Debt (Debt/(Debt+Equity))
Cost of Debt = Pre-tax rate (1 – tax rate)
Understanding WACC
As we know debt and equity are two components that constitute a company’s capital funding. Both lenders and equity holders expect to receive certain returns on the funds or capital they have provided. Cost of capital is the return that shareholders and debt holders expect and WACC indicates the return that both kinds of stakeholders can expect to receive. Hence, we can say, WACC is an investor’s opportunity cost of taking on the risk of investing money in a company.
A firm’s WACC is the overall required return for a firm. Because of this, company directors will often use WACC internally in order to make decisions, like determining the economic feasibility of mergers and other expansionary opportunities. WACC is the discount rate that should be used for cash flows with a risk that is similar to that of the overall firm.
Who Uses WACC?
Securities analysts frequently use WACC when assessing the value of investments and when determining which ones to pursue.
Investors may often use WACC as an indicator of whether or not an investment is worth pursuing. Put simply, WACC is the minimum acceptable rate of return at which a company yields returns for its investors. To determine an investor’s personal returns on an investment in a company, simply subtract the WACC from the company’s returns percentage.
The lower the WACC of a company the better, as it indicates that the company is able to raise funds at a lower cost. Ideally, the Return on Invested Capital (ROIC) of a company should be greater than its WACC.
A company that wants to lower its WACC may first look into cheaper financing options. It can issue more bonds instead of stock because it’s a more affordable financing option. This will increase the debt-to-equity ratio, and because debt is cheaper than equity, WACC will decrease.
MarketXLS WACC template can be used to compare the cost of capital of up to 5 companies and understand which one is able to raise funds cheaply. Since WACC varies with Industry, ideally it should be used to compare companies in the same sector but can be used either way as well.
Steps to use the template
Step 1: Enter up to 5 stocks to be compared in the cell range (B4:F4)
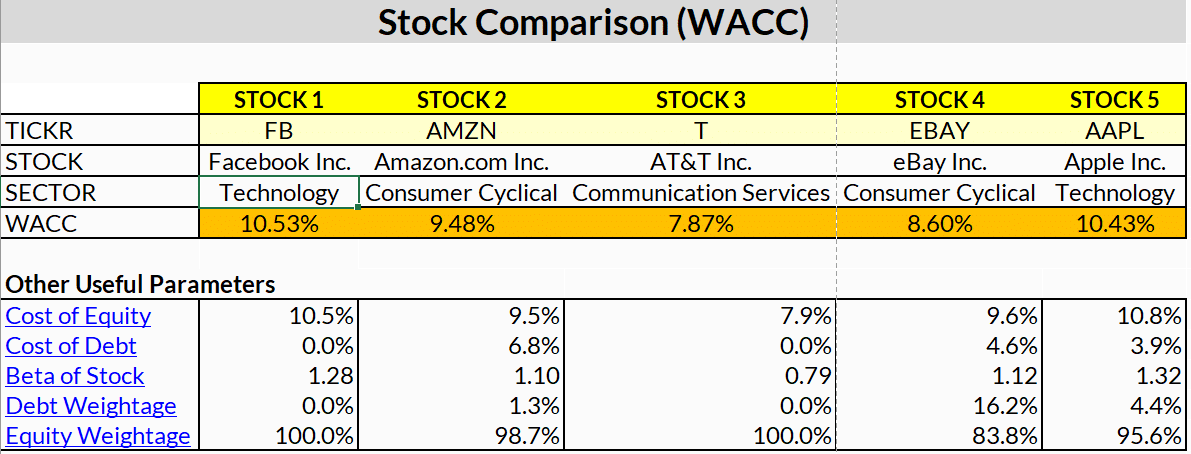
Step 2: The calculated WACC can be seen in the cell range below along with other useful parameters below it
As can be seen in the image above, we have calculated WACC for Facebook, Amazon, AT&T, eBay, and Apple. The WACC for AT&T is the lowest indicating it is able to raise funds at a lower cost.
Limitations of WACC
Certain elements of the formula, like the cost of equity, are not consistent values, various parties may report them differently for different reasons. As such, while WACC can often help lend valuable insight into a company, one should always use it along with other metrics when determining whether or not to invest in a company.
Disclaimer
None of the content published on marketxls.com constitutes a recommendation that any particular security, portfolio of securities, transaction, or investment strategy is suitable for any specific person.
The author is not offering any professional advice of any kind. The reader should consult a professional financial advisor to determine their suitability for any strategies discussed herein.
The article is written to help users collect the required information from various sources deemed an authority in their content. The trademarks, if any, are the property of their owners, and no representations are made.
References
https://medium.com/magnimetrics/understanding-the-weighted-average-cost-of-capital-wacc-948182d97e6
https://www.wallstreetprep.com/knowledge/wacc-weighted-average-cost-capital-formula-real-examples/


