
Technical Indicators in Excel
MarketXLS calculates more than 120 technical indicators in Excel, including moving averages, RSI, MACD, Bollinger Bands, and stochastics. Use worksheet functions such as =SimpleMovingAverage("AAPL", 50) and =ExponentialMovingAverage, or run the technical analysis tool on price data in your sheet with your own time periods and moving-average types. The same tool scans price history for candlestick patterns.
Get Access to 1 Billion Usable Market data points IN YOUR EXCEL SHEETS WITH EASY TO USE EXCEL FUNCTIONS
Get started today

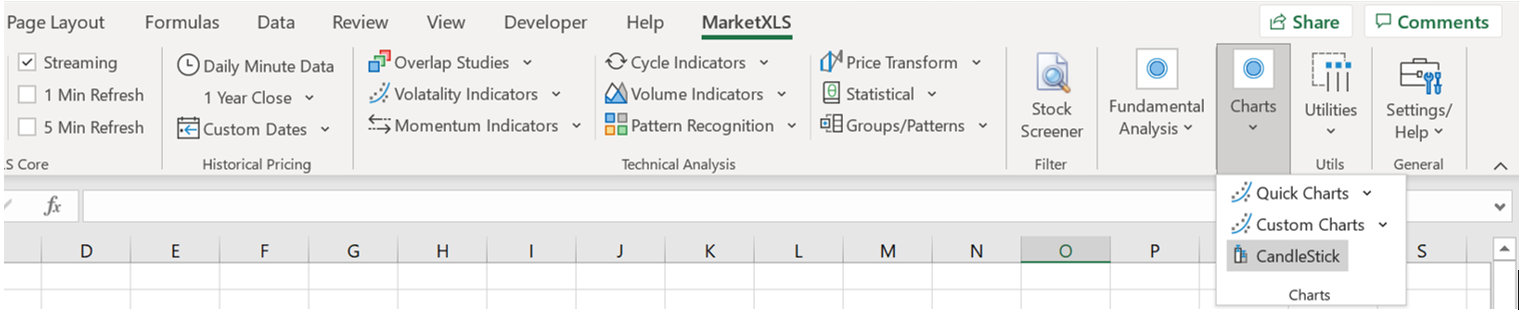
What the MarketXLS technical analysis tool does
Runs technical analysis in Excel with 120+ technical indicators.
Runs groups of indicators on your data at once.
Lets you set the time period, moving-average type, and other inputs for each indicator.
Can run with default inputs without prompting you.
Finds candlestick patterns in your data and measures their effect on later closing prices.
Annotates patterns on candlestick charts.
Produces a Pattern-Scan Report that summarizes the patterns found, for technical analysis in Excel sheets.
Uses standard defaults, such as 14 days for RSI, unless you enter your own parameters.
OVERLAP STUDIES
MOMENTUM INDICATORS
CYCLE INDICATORS
VOLUME INDICATORS
PATTERN RECOGNITION
STATISTIC FUNCTIONS
PRICE TRANSFORM
- Bollinger Bands
- Double Exponential Moving Average
- Exponential Moving Average
- Hilbert Transform – Instantaneous Trendline
- Kaufman Adaptive Moving Average
- Moving average
- MESA Adaptive Moving Average
- Moving average with variable period
- MidPoint over period
- Midpoint Price over period
- Parabolic SAR
- Parabolic SAR – Extended
- Simple Moving Average
- Triple Exponential Moving Average T3
- Triple Exponential Moving Average
- Triangular Moving Average
- Weighted Moving Average
- Average Directional Movement Index
- Average Directional Movement Index Rating
- Absolute Price Oscillator
- Aroon
- Aroon Oscillator
- Balance Of Power
- Commodity Channel Index
- Chande Momentum Oscillator
- Directional Movement Index
- Moving Average Convergence/Divergence
- MACD with controllable MA type
- Moving Average Convergence/Divergence Fix 12/26
- Money Flow Index
- Minus Directional Indicator
- Minus Directional Movement
- Momentum
- Plus Directional Indicator
- Plus Directional Movement
- Percentage Price Oscillator
- Rate of change : ((price/prevPrice)-1)*100
- Rate of change Percentage: (price-prevPrice)/prevPrice)
- Rate of change ratio: (price/prevPrice)
- Relative Strength Index
- Stochastic
- Stochastic Fast
- Stochastic Relative Strength Index
- 1-day Rate-Of-Change (ROC) of a Triple Smooth EMA
- Ultimate Oscillator
- Williams’ %R
- Hilbert Transform – Dominant Cycle Period
- Hilbert Transform – Dominant Cycle Phase
- Hilbert Transform – Phasor Components
- Hilbert Transform – SineWave
- Hilbert Transform – Trend vs Cycle Mode
- Chaikin A/D Line
- Chaikin A/D Oscillator
- On Balance Volume
- Two Crows
- Three Black Crows
- Three Inside Up/Down
- Three-Line Strike
- Three Outside Up/Down
- Three Stars In The South
- Three Advancing White Soldiers
- Abandoned Baby
- Advance Block
- Belt-hold
- Breakaway
- Closing Marubozu
- Concealing Baby Swallow
- Counterattack
- Dark Cloud Cover
- Doji
- Doji Star
- Dragonfly Doji
- Engulfing Pattern
- Evening Doji Star
- Evening Star
- Up/Down-gap side-by-side white lines
- Gravestone Doji
- Hammer
- Hanging Man
- Harami Pattern
- Harami Cross Pattern
- High-Wave Candle
- Hikkake Pattern
- Modified Hikkake Pattern
- Homing Pigeon
- In-Neck Pattern
- Inverted Hammer
- Kicking
- Ladder Bottom
- Long Legged Doji
- Long Line Candle
- Marubozu
- Matching Low
- Mat Hold
- Morning Doji Star
- Morning Star
- On-Neck Pattern
- Piercing Pattern
- Rickshaw Man
- Rising/Falling Three Methods
- Beta
- Pearson’s Correlation Coefficient
- Linear Regression
- Linear Regression Angle
- Linear Regression Intercept
- Linear Regression Slope
- Standard Deviation
- Time Series Forecast
- Variance
- Average Price
- Median Price
- Typical Price
- Weighted Close Price
The Pattern-Scan Report scans a stock's price history for candlestick patterns and shows each pattern's effect on closing prices.
Call: 1-877-778-8358 
I'm Ankur, the founder and CEO of MarketXLS. Our team can demonstrate how MarketXLS brings market data and research tools into Excel.
Book a demo with our team to explore the features and workflows relevant to your research.
Book a demo with our team to explore the features and workflows relevant to your research.
Implement "your own" investment strategies in Excel with thousands of MarketXLS functions and templates.
I use MarketXLS to manage my personal portfolio. I can easily pull in stock quotes, betas, and dividends. I also like to access historical closing prices on a particular date. That makes tracking performance easy.
I have used lots of stock and option information services. This is the only one which gives me what I need inside Excel.
I can now concentrate on manipulating financial data, valuing stocks and making investment decisions, rather than hacking around with VBA or copying and pasting data from websites.
I have been using MarketXLS for the last 6+ years and they really enhanced the product every year.
I Love My MarketXLS. The market speaks to you when you know how to listen. With MarketXLS, the market truly does speak. Patterns emerge. Pricing behavior becomes clearer.