What is the Bear Put Spread?
A bear put spread is an options strategy that consists of buying one put option with a higher strike price and at the same time selling one put option with a lower strike price. Both the put contracts have the same underlying stock and expiration date. Traders can establish this strategy when they have a moderately bearish outlook.
Both the profit and loss are capped in this strategy. Maximum gain realizes if the underlying stock falls at or below the short put strike (lower strike). The maximum loss occurs if the underlying stock moves at or above the long put strike (higher strike). Both the put contracts will expire worthless if the underlying stock closes at or above the long put strike.
Let’s built Bear Put Spread option strategy in Excel using the MarketXLS template.
Step-1: provide the inputs
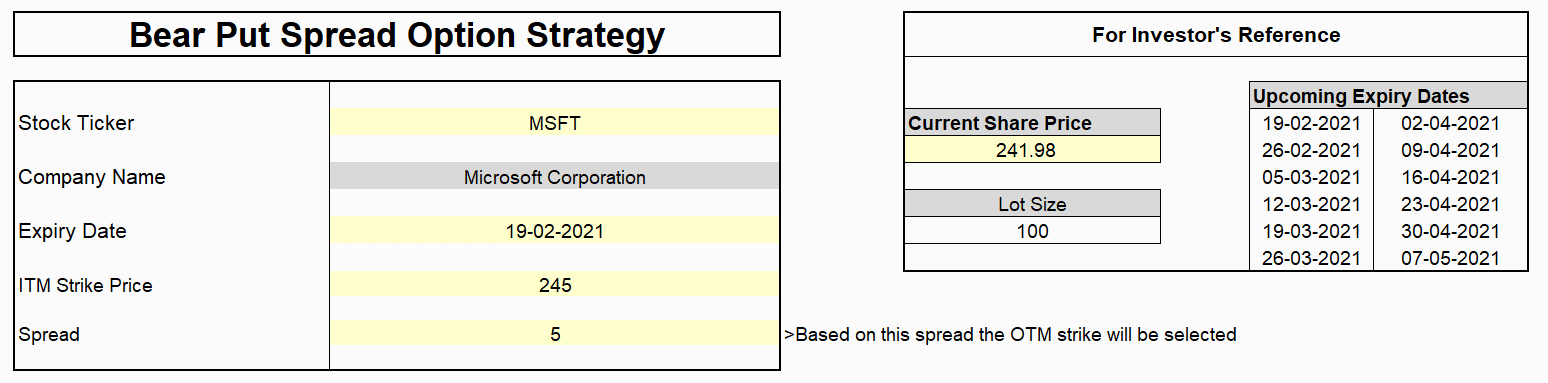
Provide the Stock Ticker, Expiry Date, ITM strike price, and Spread (higher strike – lower strike) for the strategy. Upcoming expiry dates are available for reference.
Here, we have built a bear put spread with MSFT. Currently, MSFT is trading at $241.98. We have selected an ITM strike of $ 245 and a spread of $5. Our spread will expire on 19-2-2021.
Step-2: Setup of the Bear Put Spread strategy
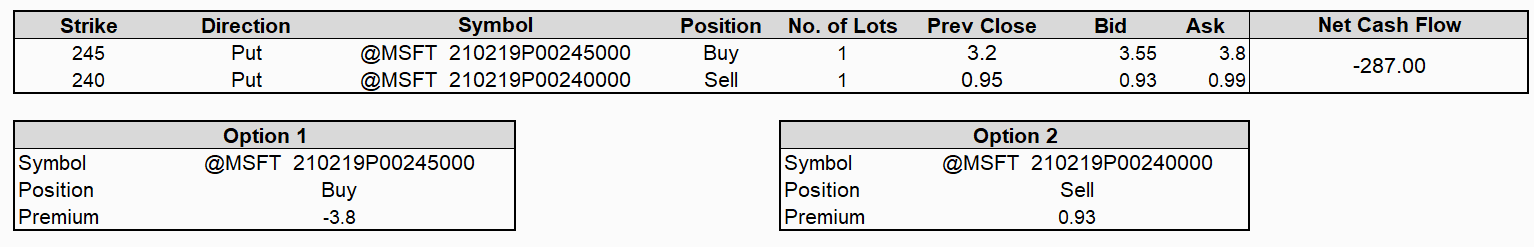
- Bought one $245 ITM put option contract of MSFT at $380 (3.8*100).
- Sold one $240 OTM put option contract of MSFT at $93 (0.93*100).
- Net premium paid = $287 ($380 – $93).
- We have built net debit strategy and paid $287 upfront to enter into the trade.
Step-3: Payoff schedule and diagram at the expiration date
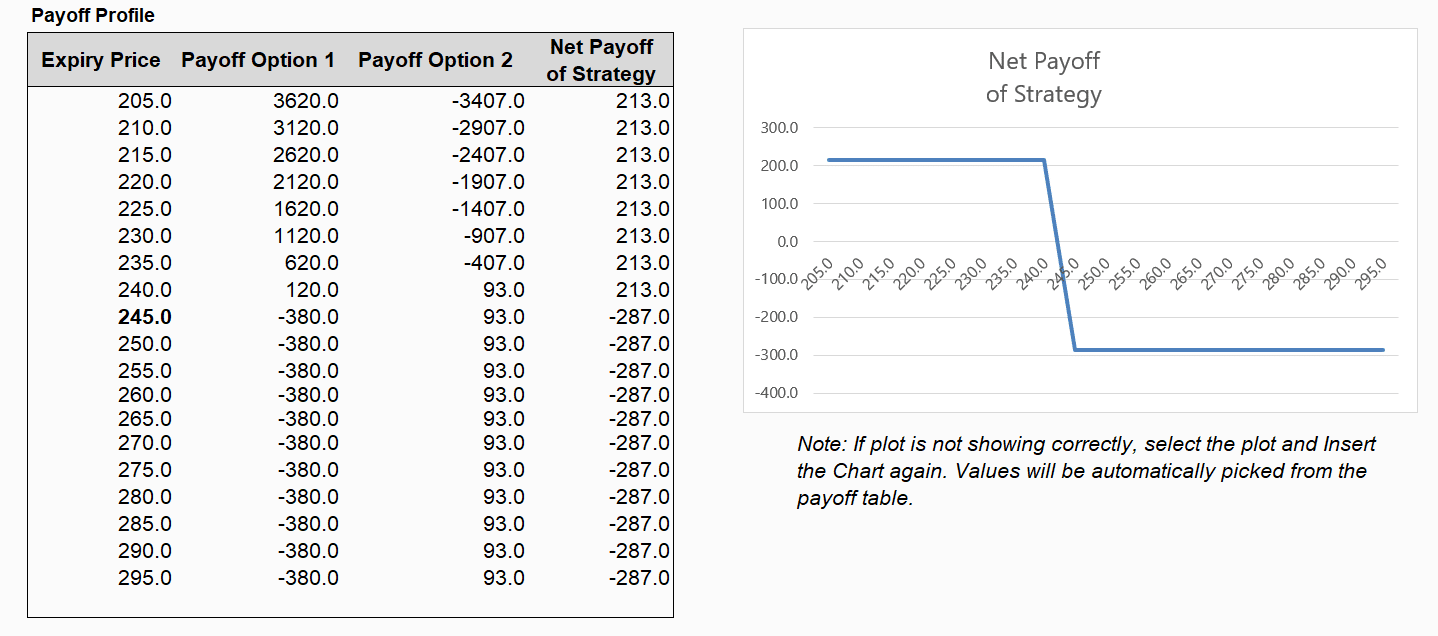
Here you will find the payoff schedule and payoff diagram alongside. The maximum loss of $287 occurs if the underlying price moves up at or above $245. And the maximum gain of $213 realizes if the underlying stock goes down at or below $240. The profit and the loss are limited in this strategy as the benefit from the long put is offset by the loss on the short put if the underlying stock goes down.
Maximum profit
Maximum profit is equal to the difference between the higher strike and the lower strike minus the net cost incurred (excluding commissions).
Maximum profit= ($5 – $2.87)* 100 = $213.
Maximum loss
Maximum loss is equal to the spread’s cost—the amount paid to enter into the trade. Therefore, the maximum risk is limited to the amount you paid upfront while entering into the transaction.
Maximum loss= $287.
Break-even
Breakeven is the point of zero profit and zero loss. The underlying stock should move down to the long strike minus the net premium paid to achieve the break-even. Hence, if the underlying stock closes at $242.13 ($245 – $2.87) on the expiration, there will be neither profit nor loss on our bear put spread.
Bottom line
If the trader expects the stock to fall within the particular range till the expiration date, then bear put spread can be a good deal. Selling a put contract helps to reduce the cost of the trade. The risk in bear put spread is lesser compared to buying a put contract alone. The maximum potential profit is also limited; hence, the long put’s gain is offset by the short put’s loss if the stock falls sharply. Since both profit and loss is limited we can square off the position before the expiration of the contract as soon as the stock price hits the target.
Disclaimer
None of the content published on marketxls.com constitutes a recommendation that any particular security, portfolio of securities, transaction, or investment strategy is suitable for any specific person.
The author is not offering any professional advice of any kind. The reader should consult a professional financial advisor to determine their suitability for any strategies discussed herein.
The article is written for helping users collect the required information from various sources deemed to be an authority in their content. The trademarks,if any, are the property of their owners, and no representations are made.
Reference
To know more about options trading, click here.
To know more about bear put spread, click here.
")
