Calculate Piotroski F-Score In Excel Using Marketxls

Meet The Ultimate Excel Solution for Investors
- Live Streaming Prices Prices in your Excel
- All historical (intraday) data in your Excel
- Real time option greeks and analytics in your Excel
- Leading data in Excel service for Investment Managers, RIAs, Asset Managers, Financial Analysts, and Individual Investors.
- Easy to use with formulas and pre-made sheets
The biggest challenge any value investor faces is to screen the best stocks for investment and filter out the bad ones. While there are many strategies that investors use to identify value stocks, one recommended strategy is the Piotroski’s F-score strategy that focuses on identifying winning stocks. In this article, we will learn about what F-score is and how to calculate Piotroski F-score in Excel.
Joseph Piotroski is a Chicago Accounting professor who devised the F-score strategy. F-score is a scoring system to identify companies that show financial strength and are undervalued.
The Scoring System
We calculate the F-score using nine fundamental parameters about the stock. For each parameter, if the parameter meets the criteria, we award a score of 1. Otherwise for that parameter we award a score of 0. We then add the scores for each parameter to arrive at a final score that can range from 0 to 9. If a stock score 7-9 it is good. But, stocks that score less than 3 are considered to be very weak.
The Nine Parameters
We need nine parameters to calculate the F-score. The parameters are divided into three broad categories.
Profitability
Profitability measures the ability of a firm to generate positive cash flows or profits. We have 4 parameters related to profitability:
- Net Income. Net income is calculated as total income for the year minus the total expenses for the year. If the net income from the most recent financial statement is positive, then we award a score of 1 to the stock. Profit is a sign of strength..
- Operating Cash Flow. If cash flow from operations is greater than zero, then we award a score of 1 to the stock. Positive cash flows are important for internal financing and are a sign of strength..
- Return on Assets. We can calculate return on assets as net profit divided by assets. We need to calculate the return on assets for the past two years. If the ROA has increased year-on-year, then we award a score of 1 to the stock. This parameter provides a sign of the positive trend in asset returns.
- Earnings Quality. We can measure the earnings quality of a stock by comparing its “cash flow from operations” with its “net income”. If operating cash flow is greater than net income, then we award a score of 1 to the stock. This is important because operating cash flows are usually higher than net income. They not affected by non-cash items. For this reason, investors must be careful if the trend shows otherwise.
Capital Structure
This category measures changes in leverage, liquidity and sources of funding. The parameters here provide a sign of the ability of the firm to meet its debt service obligations.
-
- Long-term Debt-to-Assets ratio. If the long-term debt-to-equity ratio for the previous fiscal year is less than the ratio two-years ago, then we award a score of 1 to the stock. If the leverage has decreased, it is a positive sign.
- Current ratio (Change in Liquidity). If the current ratio for the previous fiscal year is greater than the current ratio for the fiscal year two years ago, then we award a score of 1 to the stock.
Furthermore, we want the company to have high liquidity.
- Change in Average Shares Outstanding. If the “average number of shares outstanding” for the previous fiscal year is less or equal to the “average number of shares outstanding” for the fiscal year two years ago, then we award a score of 1 to the stock. In conclusion, an increase in outstanding shares is a negative sign.
Operating Efficiency
This category measures changes in a company’s’ productivity. It also measures its ability to use its assets.
- Change in Gross Margin. If the gross margin has increased in the past two years, then we award a score of 1 to the stock. A rising gross margin indicates increasing prices or decreasing costs. This again is a positive signs for the firm.
- Asset Turnover. Investors can calculate the asset turnover ratio as total sales divided by total assets. We award a score of 1 to the stock if the asset turnover ratio has increased over the past two years.
We award scores based on all these 9 parameters and then total score represents the F-score. The higher the score, the better is the investment.
You should use the Piotroski F-score as a supplement along with other screening strategies.
Calculating Piotroski F-score in Excel
As we have seen, it’s an easy to calculate yet high impact measure. Also, it makes use of fundamentals information available in financial statements. Since MarketXLS provides all the required fundamentals information for stocks, we can calculate Piotroski F-score in Excel using data fetched using MarketXLS. Let’s finally take a look at how we can do it.
Let’s say you want to calculate the F-score for the Facebook stock (Stock Symbol FB) and some other stocks. We will make use of the Historical fundamental functions available in MarketXLS. We can access this category of function through Excel’s in-built function menu as shown below:
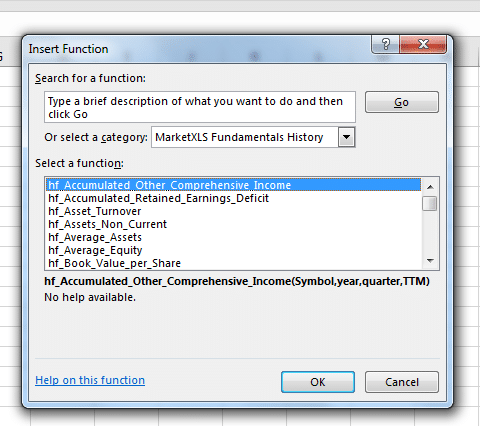
All functions in this category start from a prefix “hf_” where hf stands for “Historical Fundamentals”. We can use these functions to get historical values of fundamentals from a company’s financial statements. Also, all the values returned from these functions are from SEC filings.
You can just start typing =hf_ and Excel will also give a list of all functions available like shown below:
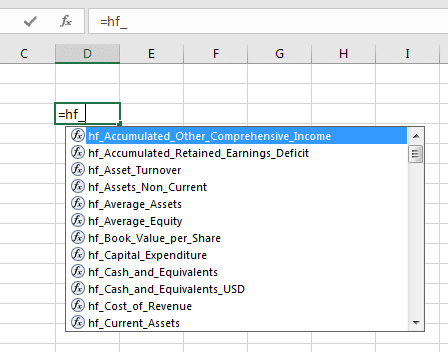
Since all these functions are consistent in format that makes it easy to use them.
Revenue of FB Year 2016 : =hf_Net_Income(“FB”,”2016″)TTM Revenue of FB Year 2016 Q3 : =hf_revenue(“FB”,”2016″,”3″,”TTM”)
Following are the arguments for these functions:
- Symbol. Any US stock symbol
- Year. Year as string. Enclose the year number in Double quotes if entering in the formula itself. You can also refer to a cell that carries the year numeric value.
- Optional. Quarter Number – Enclose the Quarter number in Double quotes if entering in the formula itself. You can also refer to a cell that carries the year numeric value.
- TTM. Type “TTM” within double quotes. TTM is optional.
Important Note
All Quarterly values refer to Calendar Quarters and not the fiscal quarters. So, when you ask to get data for Q1 it means data for January to March End. Now this period could actually be Quarter 3 in some companies whose Fiscal year is from April to March.
These formulas are useful when you want to analyze the fundamental strength of a company. Since these functions are in Excel you can use them in many ways. Such as, for comparing many companies for many metrics over time. You can also look at trends of revenue, etc.
Getting Piotroski F-score in Excel Using MarketXLS Functions
We now know how we can get historical fundamentals data in excel using MarketXLS. We can therefore calculate the 9 parameters of Piotroski F-score in Excel using these functions.
The first parameter is the Net Income. We can get net income using the following formula:
=hf_Net_Income(“FB”,”2016”)
With this formula, we will get the net income for Facebook for the year 2016. Once we have the values, we can write an if condition to check if this value is positive and assign the score.
We can calculate all 9 parameters using the formulas. Then compare values and assign scores using if conditions.
| S. No. | Parameter | Formula |
| 1 | Net Income | =hf_Net_Income(“FB”,”2016”) |
| 2 | Operating Cash Flow | =hf_Net_Cash_Flow_from_Operations(“FB”,”2016) |
| 3 | Return on Assets | =hf_Return_on_Average_Assets(“FB”,”2016,”4″,”TTM”) |
| 4 | Earnings Quality | =hf_Net_Cash_Flow_from_Operations(“FB”,”2016”) – hf_Net_Income(“FB”,”2016”) |
| 5 | Long-term Debt-to-Assets Ratio | =hf_Total_Debt($C$4,D8)/hf_Total_Assets(“FB”,”2016”) |
| 6 | Current Ratio | =hf_Current_Ratio(“FB”,”2016”) |
| 7 | Average Shares Outstanding | =hf_Weighted_Average_Shares(“FB”,”2016”) |
| 8 | Gross Margin | =hf_Gross_Margin(“FB”,”2016”,4,”TTM”) |
| 9 | Asset Turnover | =hf_Asset_Turnover(“FB”,”2016”,4,”TTM”) |
In Summary, we can now add the individual scores and get the total score.
Buy Pitroski F Score MarketXLS Template

These templates are open and have no password. Please feel free to modify as per your needs and extend them for your portfolios.
- Pitroski F Score Excel Template
Instant Delivery
Secure Processing

I invite you to book a demo with me or my team to save time, enhance your investment research, and streamline your workflows.