Discounted cash flow or DCF is the method for estimating the current value of an investment by taking into account its future cash flows. It can be used to determine the estimated investment required to be made in order to receive predetermined returns. In short, DCF analysis attempts to figure out the value of an investment today, based on projections of how much money it will generate in the future.
For example, $50 will be worth more currently than 1 year later owing to interest accrual and inflation. If a person is seeking to invest $50 now, he or she will want to know its return on investment and what its future valuation will be, which can be calculated through DCF.
Where Can the Discounted Cash Flow Method Be Used?
DCF can be used to estimate the valuation of –
• A business
• Real estate
• Stocks
• Bonds
• Long-term Assets
• Equipment
Assumptions in DCF:
The underlying assumption in Discounted Cash Flow is that a company or an asset is expected to make money (generate cash flow) over time. The second assumption, which is also a fundamental theory, is that the value of money today is worth more than it will be tomorrow.
Based on the two principles, the method derives its model and also its name – Discounted Cash Flow
▪ Discounted is adjusting for the diminishing value of money
▪ Cash Flow is the money generated by a business/asset
The Method:
Here’s the equation:
Discounted Cash Flow = CF1 / (1+dr)1 + CF2/ (1+dr)2 +…..+ CFn/ (1+dr)n, where
▪ Discounted Cash Flow – It is the sum of all future discounted cash flows that an asset/company is expected to produce. This sum is the fair value that we are solving for.
▪ CF – It is the total cash flow for a given year. CF1 is for the first year, CF2 is for the second year and so on.
▪ dr – It is the discount rate which is nothing but the target rate of return that you are looking for from the investment. It is the weight average cost of capital (WACC).

Application in Real Life:
When you are looking to buy shares of a company, you need to project and discount the expected cash flows.
If you find that an investment that is priced below the sum of discounted cash flows, it depicts undervaluation and, therefore, a potentially rewarding investment.
On the other hand, if the price is higher than the sum of discounted cash flows, the asset may be overvalued.
Pros of DCF Analysis:
• Incredibly detailed and includes all significant assumptions regarding the business
• It helps determine the “intrinsic” value of a business
• It does not require any comparable companies
• Model is suitable for analyzing mergers and acquisition
• Used to compute the internal rate of return IRR of an investment which is critical for making investing decisions
Cons of DCF Analysis:
• The fundamental drawbacks of the model are that significant time is required to project the variables that are involved. While some parameters such as operating cost and revenue may be easy to anticipate in advance, but getting the right understanding of capital expenditure, other investments and funding mix remain an area of concern. Thus, even a minor deviation in any of the metrics leads to a vast change in the company’s valuation.
• The future cash flows would rely on a variety of factors, such as market demand, the status of the economy, technology, competition, and unforeseen threats or opportunities.
• Estimating future cash flows too high could result in choosing an investment that might not pay off in the future, hurting profits. Estimating cash flows too low, making an investment appear costly, could result in missed opportunities. Choosing a discount rate for the model is also an assumption and would have to be estimated correctly for the model to be worthwhile.
How to Apply the Discounted Cash Flow Calculator Using MarketXLS Template:
The output of valuation is the intrinsic value of a stock. The intrinsic value is compared with the current market value.
1) If Intrinsic value < Market value –> The stock is Overvalued
2) If Intrinsic value > Market value –> The stock is Undervalued
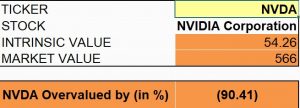
Step 1: Enter the stock ticker in cell B15 of the sheet to get the result. Here I have taken stock of NVIDIA Corporation as an example.

Link: https://marketxls.com/template/dcf-model/
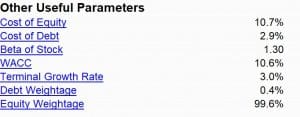
Step 2: Other useful parameters will be calculated as well. Scroll down below to check them.

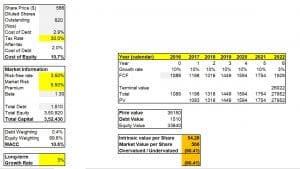
Step 3: For deeper analysis, switch to the calculation sheet and look at the detailed working of a DCF model.

Since the calculated intrinsic value per share comes out to be lower than the market value per share, the stock is overvalued by 90.41% according to the DCF model of valuation.
Why Use This Template?
The DCF valuation can be used to assess how the market has Overvalued/Undervalued a company and by what percentage.
The model also estimates and calculates loads of important data about a company such as Future cash flows, Firm’s value, Beta, Cost of equity, Cost of debt, WACC, etc.
Disclaimer:
All trademarks referenced are the property of their respective owners. Other trademarks and trade names may be used in this document to refer to either the entity claiming the marks and names or their products. MarketXLS disclaims any proprietary interest in trademarks and trade names other than its own, or affiliation with the trademark owner.
None of the content published on marketxls.com constitutes a recommendation that any particular security, portfolio of securities, transaction, or investment strategy is suitable for any specific person. The author is not offering any professional advice of any kind. The reader should consult a professional financial advisor to determine their suitability for any strategies discussed herein. The article is written for helping users collect the required information from various sources deemed to be an authority in their content. The trademarks if any are the property of their owners and no representations are made.
Reference:
https://www.investopedia.com/terms/d/dcf.asp
https://groww.in/blog/what-is-dcf-discounted-cash-flow-and-why-is-it-important/
Image Source:
https://www.zilculator.com/real-estate-analysis/calculate-discounted-cash-flow-formula-excel-example


