Dupont analysis in Excel with MarketXLS
Dupont analysis is a way to look at two ratios, ROA and ROE. Mainly, we decompose these ratios and look at different parts of these, so maybe we can get a better understanding of what is going on in the firm. Scientists at Dupont Corporation first used Dupont analysis in the 1920’s. This article explains the concept and provides the guidance on how to do Dupont analysis in Excel with MarketXLS
Essentially, DuPont analysis an accounting equation, so before we go into the detail let us look at what ROA and ROE are.
So, let’s say we have revenues of USD 100 and Expenses of USD 90 in our income statement. Our Net Income in the Income statement is USD 10. On the Balance Sheet, let’s say we have Assets of USD 100 and liabilities of USD 50.
ROA is the return on the Assets. So, in our example its 10/100 (10%). In essence, it is an indicator of how a firm can utilize the Assets it has. ROE, on the other hand, is the return on the equity. Think about equity as if you pay back all your liabilities how much Assets you will be left. So, in our example, Equity will be Assets – Liabilities = 100-50 = USD 50. So, ROE is essentially a return on this equity so 10/50 (20%).
Two main elements drive Net Income; you could either sell more or you less but with a higher margin.
So, let’s say there are two companies with the same net income; one company could be generating this revenue by selling more and other company could be making same net income by selling less with higher margins. So, the fundamental idea is that just by looking at ROA we can not make out if this return is more due to better margins or its due to more sales.
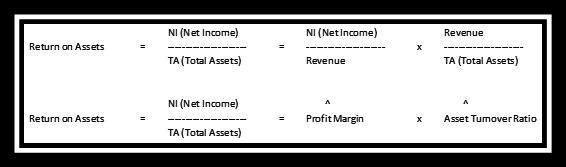
We can demonstrate this by multiplying and divide the ROA equation by Revenue. The first element is the Profit Margin and the second one is asset turnover ratio.
If a company has zero liabilities, that means equity finances all the assets of the enterprise. If that is the case, then the ROE will be equal to ROA. However, in a typical situation, ROE will be higher than the ROA because equity is a part of the assets.
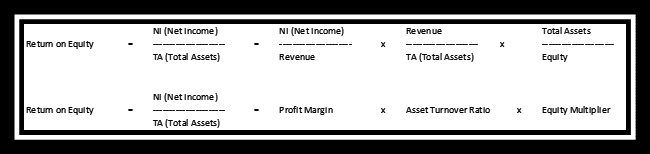
For ROE, if you multiply the previous equation by a factor called Equity Multiplier (which is a way to show how much of the total assets is from equity) you get the ROE. Now, if all the assets come from the equity multiplier will be 1, so ROE and ROA will be the same.
So, Dupont analysis just another way of looking at the ROE and ROA and decompose its parts to find out which part in the ratio is making the ratio look better or worse.
Different industries may have different benchmark margins and asset turnover ratios. So, when comparing companies, we will see what if they are reflective of the industry or not.
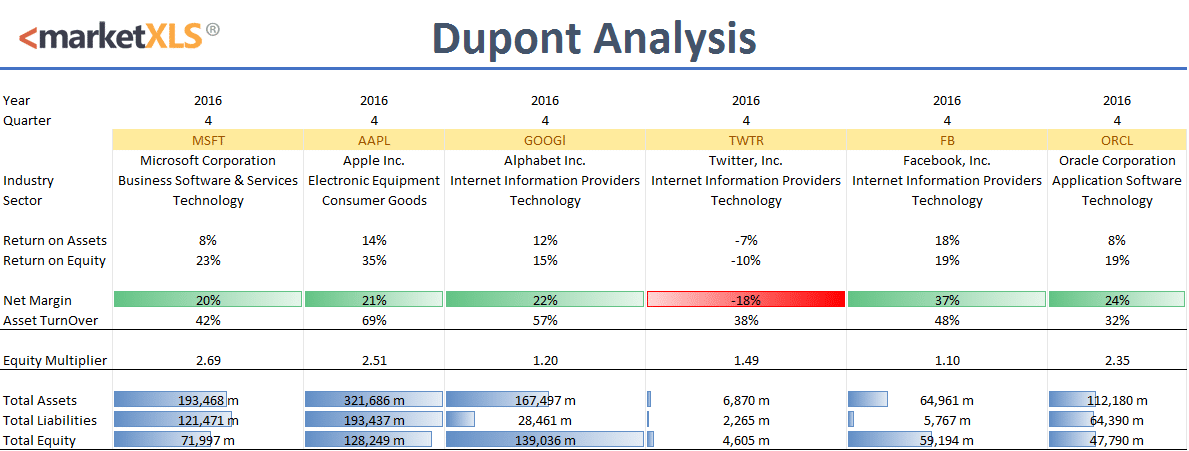
We have created the template to do Dupont analysis in Excel, you can use it with MarketXLS