Efficient Frontier Using Excel (With Marketxls)


The Efficient frontier using excel is one of the most important financial tools that help an investor compose an investment portfolio with the maximum returns and minimum amount of risk. This article will discuss what it is, how it is then calculated, and how MarketXLS calculates it of your Portfolio.
Contents:
- What is Efficient frontier
- Importance of Efficient frontier
- Optimal Portfolio by Efficient frontier
- How MarketXLS Calculates Efficient frontier of Portfolio
What is an Efficient frontier?
The Efficient frontier, also known as the portfolio frontier, represents the set of efficient portfolios that will give the highest return at each level of risk or the lowest risk for each level of return. The set of efficient portfolios is produced by the combination of different weights to get maximum expected return.
The Efficient frontier is a curve representing a combination of various securities to produce a different level of return.This frontier is formed by plotting the expected return on the y-axis and the standard deviation as a measure of risk on the x-axis.
For building the frontier, there are three crucial factors to be taken into consideration:
- Expected Return
- The covariance of one asset’s return to that of another asset.
- Variance/ Standard Deviation as a measure of the variability of returns known as risk.
The efficient frontier allows investors to understand how a portfolio’s expected returns vary with the amount of risk taken.
Importance of Efficient frontier
This tool helps investors get the most from their investment by analyzing the risk and returns associated with an investment portfolio and assisting them in adjusting their asset allocation accordingly.
It can also help determine if an investor should pull their funds from an investment with a certain amount of risk and return for a similar investment with less risk and the same return. The efficient frontier is important as it minimizes risk while maximizing rewards or returns.
The Optimal Portfolio by Efficient frontier
An optimal portfolio would offer a perfect balance between risk and return. The optimal portfolio contains:
- Securities with the highest potential returns with an acceptable degree of risk.
- It features securities with the lowest degree of risk for a certain level of return.
- Optimal returns tend to lie along the efficient frontier.
A risk-ready investor could choose securities right end of the efficient frontier. Those would likely have a high degree of risk coupled with high potential returns. Meanwhile, securities on the left end of the efficient frontier would be suitable for more cautious investors.
How MarketXLS Calculates Efficient frontier of your Portfolio
MarketXLS® completely automates the process of calculating the Efficient frontier using excel to get the optimal portfolios which tend to lie along the efficient frontier.
The following inputs are required to be entered by the investor:
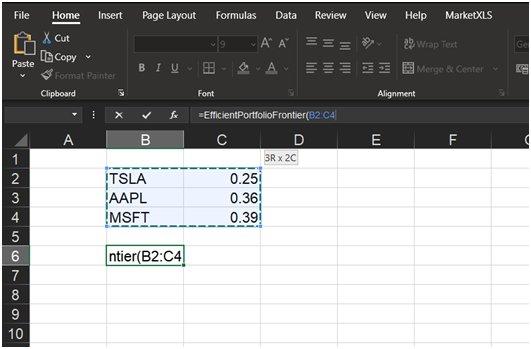
- Symbol of the asset: Enter the ticker under which the security in your Portfolio is traded.
- Weight of the asset in your Portfolio: Enter the percentage weight of each security, as shown below.
Input:
Output:
Optional Fields:
Risk-free-rate(Rf):
To account for individuality in investor outlook, we make sure to give you the flexibility of determining what Mar/Rf you think is most viable. Default value: MarketXLS assumes a Mar/Rf of 0% by default to calculate the ratio.
Months under observation:
To determine how many months you want to utilize retrospectively to arrive at your calculation, you may input the number of months you feel best, given that all the securities in your Portfolio have existed long enough to have data for those periods. Default Value: In the absence of any user input, MarketXLS uses the data for the preceding 12 months from the date of the query.
Number of Points:
This refers to the number of points for which data is calculated for plotting the frontier. Default Value: MarketXLS calculates 100 points of data by default.
The GMV Portfolio:
The global minimum variance portfolio (GMV portfolio), is the portfolio with the lowest possible standard deviation (risk) out of all possible levels of expected return.
Calculation:
The following is how the MarketXLS add-in calculates the Efficient frontier for your Portfolio, one may note, that this also serves as an explanatory step-by-step guide for an n-asset portfolio as to how to calculate the Efficient frontier.
Method to calculate average monthly return is same for both types as follows:
- Monthly Return Calculation for Each Asset in Portfolio:
Where:
Note: To maintain consistency with theory in this regard, Close Price is a security’s Adjusted Close (Close prices adjusted for dividends and splits) of the last day of a given month, and the Open Price is the Adjusted Close price for the last day of the previous month.
- Portfolio Monthly Return Calculation:
Portfolio return for a given month is calculated as follows:
Where:
This is repeated for all the months under consideration.
- Determining Highest and Lowest Possible Expected Return on a Portfolio:
The individual return of every asset in the portfolio is determined by taking the mean of periodic returns for every asset and annualising the same to arrive at the expected return for every asset in the portfolio.
For MarketXLS as monthly data is utilized, the no. of periods in a year are taken as 12.
The lowest value among this is the lowest possible return of the portfolio and similarly as the highest.
- Determining Weights for Every Level of Return in Between:
Quadratic Linear Programming is utilised to minimize portfolio volatility for all different levels of return subject to the constraint that sum of weights equals one. Herein, the optional input regarding the number of data points determines how many points in between the data is calculated for.
- Covariance of Portfolio is Calculated:
The covariance matrix is calculated for the portfolio:
Note: This is a two and three asset example and can be done for as many assets as a portfolio might have.
- Standard Deviation of Portfolio:
The portfolio’s standard deviation is calculated below:
Where:
- Standard Deviation of Portfolio is Annualized:
To maintain consistency in periodicity of different parameters, standard deviation is annualised as follows:
Annualizing Factor = SQRT(Number of Periods a Year)
Note: Since MarketXLS uses monthly values, the annualizing factor is sqrt(12)
For instance, if taking daily data, seeing as a trading year has 252 days, multiply the ratio with the square root of 252.
Similarly,
- for yearly returns, annualizing factor = SQRT(1)
- for monthly returns, annualizing factor = SQRT(12)
- for weekly returns, annualizing factor = SQRT(52)
- for daily returns, annualizing factor = SQRT(252)
- Plotting the Efficient Frontier:
This results to derive the Efficient frontier plotted with standard deviation (risk) on x-axis and expected return on y-axis.
The portfolio with lowest risk is plotted as the GMV portfolio.
The portfolio with the highest Sharpe Ratio is used to plot the Capital Market line as a segment starting at the risk-free-rate of return on the y-axis and extending to the portfolio with the maximum sharpe ratio.
The investor can use the Efficient frontier of Portfolio excel formula to get a combination of assets that has the optimal level of expected return for a given level of risk as all the portfolios on the line are efficient. An investor can choose a suitable portfolio anywhere on the Efficient Frontier depending on his individual preferences and investment timeframe using MarketXLS.
Top 100 Gainers Today
Company Name | Sector | Last Price | Change % from Previous Close | Market Cap | PE Ratio (TTM) | Earning Per Share (TTM) | Fifty Two Week High | Fifty Two Week Low | 7 Day Return | YTD Return | |
---|---|---|---|---|---|---|---|---|---|---|---|
AEY | AEY ADDvantage Technologies Group Inc. | Technology | 1.91 | 35.46% | 19 M | -3.60 | -0.39 | 2.78 | 1.05 | 38.41% | 10.40% |
ADCT | ADCT Adc Therapeutics SA | Manufacturing | 10.30 | 26.85% | 612 M | -3.20 | -2.55 | 32.00 | 5.52 | 27.95% | -49.01% |
AAOI | AAOI Applied Optoelectronics Inc. | Technology | 2.60 | 18.18% | 51 M | -0.90 | -2.22 | 8.86 | 1.48 | 35.42% | -49.42% |
ABVC | ABVC AMERICAN BRIVISION HLDG | Wholesale Trade | 0.67 | 17.54% | 19 M | -0.90 | -0.66 | 11.69 | 0.50 | 13.87% | -80.24% |
AAMC | AAMC Altisource Asset Management Corp Com | Financial Services | 22.56 | 15.87% | 43 M | 10.60 | 2.75 | 31.89 | 8.65 | -11.18% | 43.24% |
AGEN | AGEN Agenus Inc. | Healthcare | 2.97 | 11.24% | 724 M | -20.10 | -0.10 | 6.79 | 1.25 | 13.79% | -7.76% |
ACCD | ACCD Accolade Inc. | Information | 12.91 | 10.06% | 782 M | -1.90 | -6.06 | 49.47 | 4.61 | 9.50% | -51.02% |
ACLS | ACLS Axcelis Technologies Inc. | Technology | 76.87 | 8.80% | 2,258 M | 17.20 | 4.48 | 83.74 | 41.31 | 1.81% | 3.10% |
ACB | ACB Aurora Cannabis Inc | Healthcare | 1.75 | 8.70% | 447 M | -0.40 | -4.61 | 8.69 | 1.21 | 6.06% | -67.65% |
AEHR | AEHR Aehr Test Systems | Technology | 17.76 | 8.09% | 447 M | 43.90 | 0.35 | 27.09 | 5.08 | 18.88% | -26.55% |
ACVA | ACVA ACV Auctions Inc | Wholesale Trade | 9.26 | 7.30% | 1,096 M | -13.70 | -0.58 | 22.82 | 6.10 | 16.77% | -50.85% |
ADGI | ADGI Adagio Therapeutics Inc | Professional, Scientific, and Technical Services | 3.99 | 6.40% | 418 M | -6.70 | -3.07 | 78.82 | 2.41 | 1.53% | -45.04% |
ADMA | ADMA ADMA Biologics Inc | Healthcare | 2.37 | 6.28% | 399 M | -4.30 | -0.50 | 2.48 | 1.01 | 14.49% | 68.09% |
ACST | ACST Acasti Pharma Inc. | Healthcare | 0.96 | 6.11% | 38 M | -5.00 | -0.23 | 3.86 | 0.80 | 9.77% | -24.21% |
AFRM | AFRM Affirm Holdings Inc | Information | 39.19 | 6.00% | 9,332 M | -17.70 | -2.37 | 176.65 | 13.64 | 12.29% | -61.03% |
AADI | AADI Aadi Bioscience Inc | Manufacturing | 13.95 | 5.52% | 295 M | -1.10 | -10.86 | 40.20 | 11.00 | -1.90% | -42.24% |
ACEL | ACEL Accel Entertainment Inc | Arts, Entertainment, and Recreation | 10.45 | 5.34% | 1,058 M | 24.70 | 0.49 | 14.10 | 9.19 | -11.81% | -19.74% |
ADN | ADN Advent Technologies Holdings Inc | Manufacturing | 3.16 | 5.33% | 56 M | -5.20 | -0.56 | 10.04 | 1.13 | 6.40% | -54.92% |
ACIU | ACIU AC Immune SA | Healthcare | 3.41 | 4.92% | 279 M | -3.10 | -1.02 | 12.61 | 2.06 | 7.23% | -31.11% |
AERI | AERI Aerie Pharmaceuticals Inc. | Healthcare | 11.57 | 4.33% | 554 M | -10.30 | -1.05 | 17.21 | 4.81 | 8.54% | 64.81% |
ACAD | ACAD ACADIA Pharmaceuticals Inc. | Healthcare | 16.40 | 4.19% | 2,618 M | -12.50 | -1.33 | 28.06 | 12.24 | -1.32% | -29.73% |
AER | AER Aercap Holdings N.V. | Industrials | 50.46 | 4.13% | 11,271 M | -13.30 | -3.30 | 71.38 | 37.20 | 11.42% | -22.87% |
ADV | ADV Advantage Solutions Inc. | Administrative and Support and Waste Management and Remediation Services | 4.48 | 3.94% | 1,356 M | 19.00 | 0.23 | 9.97 | 3.31 | 3.23% | -44.14% |
ADNT | ADNT Adient plc | Consumer Cyclical | 38.55 | 3.60% | 3,266 M | 4.10 | 8.43 | 50.96 | 27.15 | 12.10% | -19.49% |
ABST | ABST Absolute Software Corp | Information | 10.84 | 3.53% | 509 M | -23.20 | -0.44 | 12.62 | 6.79 | 5.76% | 15.20% |
AEO | AEO American Eagle Outfitters Inc. | Consumer Cyclical | 12.85 | 3.13% | 1,946 M | 7.30 | 2.13 | 34.22 | 10.82 | 1.74% | -49.25% |
AFYA | AFYA Afya Ltd | Educational Services | 12.33 | 3.09% | 1,041 M | 22.40 | 0.53 | 22.80 | 8.73 | 6.66% | -21.51% |
AEM | AEM Agnico Eagle Mines Limited | Basic Materials | 46.26 | 3.03% | 20,478 M | 25.10 | 1.78 | 67.14 | 38.02 | 2.80% | -12.95% |
ABM | ABM ABM Industries Incorporated | Industrials | 47.17 | 3.01% | 2,991 M | 21.00 | 2.16 | 54.00 | 38.08 | 5.53% | 15.47% |
ACR | ACR ACRES Commercial Realty Corp | Finance and Insurance | 9.71 | 2.97% | 83 M | 19.80 | 0.47 | 17.20 | 7.78 | 4.30% | -22.13% |
AG | AG First Majestic Silver Corp. (Canada) | Basic Materials | 8.37 | 2.95% | 2,178 M | -22.40 | -0.38 | 14.67 | 6.31 | -0.59% | -24.66% |
ADM | ADM Archer-Daniels-Midland Company | Consumer Defensive | 86.60 | 2.92% | 46,448 M | 13.00 | 6.37 | 98.88 | 58.44 | 4.98% | 28.13% |
ABIO | ABIO ARCA biopharma Inc. | Healthcare | 2.47 | 2.92% | 35 M | -2.00 | -1.18 | 3.17 | 1.71 | 3.78% | 14.88% |
ADT | ADT ADT Inc. | Industrials | 8.25 | 2.74% | 7,155 M | -266.70 | -0.04 | 10.39 | 6.00 | 3.13% | -1.90% |
ADI | ADI Analog Devices Inc. | Technology | 179.26 | 2.70% | 88,559 M | 53.30 | 3.56 | 191.95 | 138.50 | 1.93% | 1.99% |
ADP | ADP Automatic Data Processing Inc. | Industrials | 256.78 | 2.62% | 103,796 M | 35.50 | 7.03 | 257.16 | 192.26 | 3.29% | 4.14% |
AAP | AAP Advance Auto Parts Inc W/I | Consumer Cyclical | 202.53 | 2.59% | 11,629 M | 21.60 | 9.05 | 244.55 | 164.00 | 4.24% | -15.57% |
AEP | AEP American Electric Power Company Inc. | Utilities | 103.78 | 2.55% | 51,666 M | 19.70 | 5.09 | 104.81 | 80.22 | 3.70% | 16.65% |
ADSK | ADSK Autodesk Inc. | Technology | 233.01 | 2.53% | 47,396 M | 99.90 | 2.23 | 344.39 | 163.20 | 5.58% | -17.13% |
ADBE | ADBE Adobe Inc. | Technology | 445.67 | 2.48% | 199,635 M | 42.40 | 10.31 | 699.54 | 338.00 | 2.61% | -21.41% |
ABNB | ABNB Airbnb Inc. | Administrative and Support and Waste Management and Remediation Services | 124.51 | 2.48% | 68,252 M | 62.60 | 1.99 | 212.58 | 86.71 | 7.50% | -25.21% |
ADTX | ADTX Aditxt Inc | Manufacturing | 0.17 | 2.46% | 9 M | -0.10 | -1.66 | 3.95 | 0.12 | 6.46% | -67.43% |
ABCL | ABCL AbCellera Biologics Inc | Manufacturing | 13.68 | 2.40% | 3,161 M | 18.30 | 0.72 | 22.63 | 5.42 | 16.33% | -4.34% |
AGE | AGE AgeX Therapeutics Inc - Ordinary Shares | 0.69 | 2.39% | 26 M | -2.70 | -0.25 | 1.39 | 0.52 | 0.56% | -37.07% | |
ACCO | ACCO Acco Brands Corporation | Industrials | 6.99 | 2.34% | 632 M | 5.80 | 1.25 | 9.76 | 6.36 | -2.65% | -15.38% |
ACGL | ACGL Arch Capital Group Ltd. | Financial Services | 47.04 | 2.31% | 16,482 M | 10.80 | 4.19 | 50.73 | 37.44 | 6.55% | 5.83% |
AFL | AFL AFLAC Incorporated | Financial Services | 64.03 | 2.22% | 38,180 M | 9.00 | 6.67 | 67.20 | 51.28 | 7.47% | 9.66% |
AES | AES The AES Corporation | Utilities | 24.89 | 2.22% | 15,924 M | -42.60 | -0.53 | 26.52 | 18.62 | 4.27% | 2.43% |
ACM | ACM AECOM | Industrials | 76.57 | 2.16% | 10,279 M | 49.00 | 1.47 | 79.97 | 60.74 | 7.88% | -1.01% |
ACNB | ACNB ACNB Corporation | Financial Services | 36.01 | 2.16% | 298 M | 11.10 | 3.11 | 36.14 | 27.15 | 3.87% | 15.12% |
AAPL | AAPL Apple Inc. | Technology | 172.10 | 2.14% | 2,859,274 M | 27.30 | 6.10 | 182.94 | 129.04 | 4.39% | -3.08% |
ABOS | ABOS Acumen Pharmaceuticals Inc | Professional, Scientific, and Technical Services | 5.40 | 2.08% | 206 M | -586.10 | -2.20 | 19.46 | 3.02 | 2.47% | -20.12% |
ACN | ACN Accenture plc Class A (Ireland) | Technology | 320.44 | 1.91% | 195,957 M | 30.10 | 10.47 | 417.37 | 261.77 | 3.26% | -22.70% |
ADES | ADES Advanced Emissions Solutions Inc. | Industrials | 4.89 | 1.88% | 91 M | 2.00 | 2.39 | 8.00 | 4.41 | 2.52% | -26.13% |
ABC | ABC AmerisourceBergen Corporation | Healthcare | 150.50 | 1.85% | 29,994 M | 16.10 | 8.83 | 167.19 | 113.68 | 7.03% | 13.25% |
ACA | ACA Arcosa Inc. When Issued | Industrials | 64.84 | 1.76% | 2,998 M | 32.90 | 1.90 | 65.33 | 43.42 | 4.80% | 23.04% |
AAL | AAL American Airlines Group Inc. | Industrials | 15.25 | 1.73% | 9,501 M | -5.00 | -2.97 | 22.35 | 11.93 | 1.53% | -15.09% |
ACMR | ACMR ACM Research Inc. | Technology | 19.49 | 1.72% | 1,092 M | 40.20 | 0.55 | 39.71 | 11.23 | 3.23% | -31.43% |
ADPT | ADPT Adeptus Health Inc. | Manufacturing | 12.32 | 1.65% | 1,602 M | -7.10 | -1.64 | 40.00 | 5.96 | 5.39% | -56.09% |
ABCB | ABCB Ameris Bancorp | Financial Services | 49.69 | 1.55% | 3,285 M | 9.80 | 4.84 | 56.64 | 38.22 | 5.32% | 0.02% |
ABTX | ABTX Allegiance Bancshares Inc. | Financial Services | 46.13 | 1.54% | 897 M | 11.90 | 3.73 | 46.14 | 34.39 | 4.46% | 9.29% |
ACOR | ACOR Acorda Therapeutics Inc. | Healthcare | 0.47 | 1.52% | 11 M | -0.10 | -8.79 | 4.99 | 0.28 | 4.60% | -80.42% |
AEMD | AEMD Aethlon Medical Inc. | Technology | 1.36 | 1.49% | 22 M | -2.10 | -0.70 | 5.99 | 0.88 | -5.56% | -26.88% |
AFG | AFG American Financial Group Inc. | Financial Services | 134.77 | 1.49% | 10,878 M | 10.50 | 12.13 | 152.29 | 122.71 | 5.53% | -1.86% |
ACHC | ACHC Acadia Healthcare Company Inc. | Healthcare | 82.61 | 1.47% | 7,230 M | 26.60 | 3.10 | 83.63 | 50.07 | 1.87% | 36.10% |
ABG | ABG Asbury Automotive Group Inc | Consumer Cyclical | 184.81 | 1.46% | 3,940 M | 5.40 | 33.63 | 230.97 | 146.43 | 2.33% | 6.99% |
AEIS | AEIS Advanced Energy Industries Inc. | Technology | 95.00 | 1.40% | 3,374 M | 25.20 | 3.78 | 98.00 | 67.55 | 0.54% | 4.33% |
AAME | AAME Atlantic American Corporation | Financial Services | 3.00 | 1.35% | 59 M | 8.40 | 0.35 | 4.59 | 2.12 | 2.39% | 22.45% |
AFMD | AFMD Affimed N.V. | Healthcare | 3.05 | 1.33% | 484 M | -4.60 | -0.73 | 7.35 | 2.23 | -7.01% | -44.75% |
ADUS | ADUS Addus HomeCare Corporation | Healthcare | 94.41 | 1.31% | 1,502 M | 33.80 | 2.81 | 108.11 | 68.57 | 1.09% | 0.96% |
ADTN | ADTN ADTRAN Inc. | Technology | 24.49 | 1.28% | 1,827 M | -85.20 | -0.28 | 25.29 | 16.30 | 2.64% | 7.27% |
ABR | ABR Arbor Realty Trust | Real Estate | 15.74 | 1.22% | 2,701 M | 7.90 | 2.08 | 20.74 | 12.18 | -1.81% | -14.08% |
ABUS | ABUS Arbutus Biopharma Corporation | Healthcare | 2.50 | 1.21% | 369 M | -4.20 | -0.60 | 6.50 | 1.93 | 0.00% | -35.73% |
A | A Agilent Technologies Inc. | Healthcare | 133.55 | 1.21% | 38,497 M | 32.00 | 4.19 | 179.57 | 112.52 | 0.78% | -16.35% |
ADS | ADS Alliance Data Systems Corporation | Financial Services | 56.80 | 1.16% | 2,932 M | 3.50 | 106.08 | 53.30 | -15.65% | ||
AAON | AAON AAON Inc. | Basic Materials | 61.72 | 1.10% | 3,176 M | 55.70 | 1.15 | 83.79 | 47.50 | -0.10% | -22.30% |
AAU | AAU Almaden Minerals Ltd. | Basic Materials | 0.24 | 1.08% | 33 M | -10.20 | -0.03 | 0.49 | 0.21 | 1.25% | -18.63% |
AEVA | AEVA Aeva Technologies Inc | Manufacturing | 4.03 | 1.00% | 891 M | -7.60 | -0.59 | 10.75 | 2.47 | -9.64% | -46.69% |
ABMD | ABMD ABIOMED Inc. | Healthcare | 293.59 | 0.91% | 12,807 M | 61.80 | 4.79 | 379.30 | 219.85 | -0.06% | -18.26% |
ABT | ABT Abbott Laboratories | Healthcare | 111.48 | 0.90% | 188,974 M | 22.80 | 4.84 | 142.60 | 101.24 | 2.28% | -20.79% |
ACRE | ACRE Ares Commercial Real Estate Corporation | Real Estate | 13.81 | 0.88% | 736 M | 12.10 | 1.11 | 16.48 | 11.18 | 1.54% | -5.02% |
AEE | AEE Ameren Corporation | Utilities | 94.83 | 0.85% | 24,147 M | 23.60 | 3.92 | 99.20 | 80.27 | 3.20% | 6.54% |
AAT | AAT American Assets Trust Inc. | Real Estate | 30.43 | 0.83% | 1,790 M | 44.90 | 0.67 | 40.83 | 28.38 | 2.77% | -18.92% |
ACTG | ACTG Acacia Research Corporation | Industrials | 4.87 | 0.83% | 222 M | 1.90 | 3.62 | 7.54 | 3.30 | -2.60% | -5.07% |
ACT | ACT AdvisorShares Vice ETF | 26.96 | 0.82% | 4,240 M | 6.40 | 4.06 | 27.00 | 18.76 | 3.93% | 30.43% | |
ADMS | ADMS Adamas Pharmaceuticals Inc. | Healthcare | 8.22 | 0.74% | 376 M | -4.80 | -1.70 | 8.25 | 4.02 | ||
AGCO | AGCO AGCO Corporation | Industrials | 112.70 | 0.61% | 7,949 M | 10.20 | 10.59 | 150.28 | 88.55 | 5.19% | -2.86% |
ADC | ADC Agree Realty Corporation | Real Estate | 78.97 | 0.59% | 6,213 M | 41.00 | 1.89 | 79.98 | 61.62 | 1.94% | 10.66% |
ADIL | ADIL Adial Pharmaceuticals Inc | Healthcare | 0.58 | 0.44% | 15 M | -0.70 | -0.88 | 5.08 | 0.45 | -3.08% | -78.70% |
AEZS | AEZS Aeterna Zentaris Inc. | Healthcare | 4.99 | 0.40% | 24 M | -2.40 | -2.12 | 24.38 | 4.11 | -1.19% | -43.82% |
ABBV | ABBV AbbVie Inc. | Healthcare | 142.60 | 0.37% | 247,976 M | 19.90 | 7.11 | 175.91 | 105.56 | 1.61% | 5.32% |
AAN | AAN Aaron's Inc. | Industrials | 14.60 | 0.34% | 429 M | 8.30 | 1.79 | 31.69 | 11.98 | 0.00% | -40.77% |
ACEV | ACEV ACE Convergence Acquisition Corp | Manufacturing | 10.24 | 0.10% | 143 M | 18.90 | 10.25 | 9.63 | 0.20% | 2.81% | |
AAC | AAC AAC Holdings Inc. | Healthcare | 9.88 | 0.00% | 1,235 M | 91.80 | 0.11 | 9.90 | 9.66 | 0.00% | 1.44% |
AAIC | AAIC Arlington Asset Investment Corp | Finance and Insurance | 3.39 | 0.00% | 100 M | -11.00 | -0.29 | 4.04 | 2.88 | 2.73% | -3.14% |
ACC | ACC American Campus Communities Inc | Real Estate | 65.42 | 0.00% | 9,125 M | 130.70 | 0.51 | 65.46 | 48.01 | 0.08% | 14.19% |
ACIW | ACIW ACI Worldwide Inc. | Technology | 26.13 | 0.00% | 2,949 M | 19.90 | 1.31 | 36.01 | 23.63 | 0.81% | -24.70% |
ACRS | ACRS Aclaris Therapeutics Inc. | Healthcare | 16.80 | 0.00% | 1,177 M | -13.40 | -1.34 | 19.97 | 9.26 | -6.67% | 15.54% |
AESE | AESE Allied Esports Entertainment Inc | Arts, Entertainment, and Recreation | 1.57 | 0.00% | 61 M | 1.00 | 1.56 | 2.50 | 1.20 | 1.30% | -8.19% |
AFIB | AFIB Acutus Medical Inc. | Manufacturing | 1.66 | 0.00% | 43 M | -0.30 | -4.50 | 13.80 | 0.48 | 7.79% | -51.32% |
Top 100 losers Today
Company Name | Sector | Last Price | Change % from Previous Close | Market Cap | PE Ratio (TTM) | Earning Per Share (TTM) | Fifty Two Week High | Fifty Two Week Low | 7 Day Return | YTD Return | |
---|---|---|---|---|---|---|---|---|---|---|---|
APTX | APTX Aptinyx Inc. | Healthcare | 0.41 | -32.33% | 38 M | -0.50 | -1.15 | 3.76 | 0.36 | -31.31% | -84.79% |
APYX | APYX Apyx Medical Corporation | Healthcare | 8.25 | -19.75% | 352 M | -22.40 | -0.47 | 17.50 | 3.01 | -21.65% | -35.65% |
APDN | APDN Applied DNA Sciences Inc | Industrials | 3.70 | -18.14% | 45 M | -2.50 | -1.94 | 7.35 | 0.62 | -24.02% | -7.96% |
ANEB | ANEB Anebulo Pharmaceuticals Inc | Manufacturing | 3.85 | -15.01% | 99 M | -1.60 | -1.79 | 7.89 | 2.67 | -7.23% | -37.40% |
ACRX | ACRX AcelRx Pharmaceuticals Inc. | Healthcare | 0.27 | -13.63% | 34 M | -0.90 | -0.27 | 1.19 | 0.16 | 12.78% | -51.80% |
AGRX | AGRX Agile Therapeutics Inc. | Healthcare | 0.57 | -11.93% | 21 M | 0.00 | -26.98 | 50.40 | 0.49 | -7.38% | -97.11% |
AUID | AUID Ipsidy Inc | Manufacturing | 2.51 | -11.31% | 76 M | -3.20 | -0.92 | 18.64 | 1.45 | -15.49% | -82.11% |
ATHX | ATHX Athersys Inc. | Healthcare | 0.26 | -9.30% | 73 M | -0.90 | -0.35 | 1.81 | 0.17 | -14.87% | -71.70% |
AGL | AGL Agilon Health Inc | Manufacturing | 23.39 | -9.17% | 10,828 M | -101.30 | -0.28 | 38.47 | 14.36 | -13.59% | -13.37% |
AP | AP Ampco-Pittsburgh Corporation | Industrials | 4.01 | -8.45% | 89 M | -7.90 | -0.58 | 6.67 | 3.06 | -15.76% | -19.80% |
AIHS | AIHS Senmiao Technology Limited | Financial Services | 0.95 | -7.72% | 52 M | -10.90 | -0.17 | 9.13 | 0.84 | -49.97% | -74.31% |
AFI | AFI Armstrong Flooring Inc. | Basic Materials | 0.35 | -7.26% | 6 M | -0.10 | -2.40 | 3.87 | 0.13 | -82.26% | |
ASTR | ASTR Astra Space Inc | Manufacturing | 1.61 | -6.94% | 345 M | 1.50 | -0.90 | 13.58 | 1.19 | 24.81% | -76.77% |
APM | APM Aptorum Group Limited | Healthcare | 1.48 | -5.73% | 52 M | -2.10 | 2.94 | 0.86 | 0.00% | -1.33% | |
AUD | AUD Pimco Australia Bond Index Exch | Information | 0.69 | -5.57% | 86 M | 14.10 | 0.05 | 4.04 | 0.55 | 22.79% | -72.98% |
ADMP | ADMP Adamis Pharmaceuticals Corporation | Healthcare | 0.33 | -5.26% | 56 M | -1.40 | -0.27 | 1.48 | 0.31 | -12.08% | -45.52% |
ALTM | ALTM Kayne Anderson Acquisition Corp. | Energy | 62.35 | -5.11% | 1,013 M | 13.10 | 91.00 | 58.66 | 1.70% | ||
ALNA | ALNA Allena Pharmaceuticals Inc. | Healthcare | 0.12 | -5.02% | 14 M | -0.20 | -0.65 | 1.17 | 0.07 | -11.53% | -79.54% |
ABEO | ABEO Abeona Therapeutics Inc. | Healthcare | 4.43 | -4.94% | 23 M | -0.20 | -20.50 | 34.00 | 3.26 | 10.20% | -47.42% |
AIT | AIT Applied Industrial Technologies Inc. | Industrials | 113.43 | -4.59% | 3,995 M | 17.30 | 6.17 | 121.20 | 80.93 | 8.25% | 10.45% |
ACXP | ACXP Acurx Pharmaceuticals Inc | Professional, Scientific, and Technical Services | 4.35 | -4.10% | 46 M | -2.80 | -1.51 | 5.92 | 2.33 | 1.16% | 0.66% |
AMC | AMC AMC Entertainment Holdings Inc. Class A | Consumer Cyclical | 24.44 | -3.97% | 11,603 M | -15.50 | -1.59 | 52.79 | 9.70 | 2.00% | -10.15% |
APRE | APRE Aperture Health, Inc | Manufacturing | 0.95 | -3.90% | 22 M | -0.60 | -1.65 | 5.67 | 0.62 | -2.99% | -66.90% |
ACHV | ACHV Achieve Life Sciences Inc. | Healthcare | 5.00 | -3.85% | 48 M | -1.30 | -3.80 | 10.09 | 4.78 | 0.32% | -35.73% |
AE | AE Adams Resources & Energy Inc. | Energy | 33.75 | -3.84% | 146 M | 9.60 | 3.52 | 39.89 | 26.26 | 0.81% | 21.37% |
AEHL | AEHL Antelope Enterprise Holdings Ltd | Manufacturing | 1.09 | -3.54% | 7 M | -0.50 | 3.97 | 0.67 | -12.75% | -31.45% | |
ATNX | ATNX Athenex Inc. | Healthcare | 0.52 | -3.33% | 134 M | -0.60 | -1.72 | 3.91 | 0.41 | -52.73% | -61.76% |
ARAV | ARAV Aravive Inc. | Healthcare | 0.90 | -3.22% | 29 M | -0.50 | -2.12 | 4.40 | 0.80 | -10.45% | -59.11% |
ACI | ACI Arch Coal Inc. | Retail Trade | 28.07 | -2.91% | 15,244 M | 9.80 | 3.02 | 37.99 | 25.89 | 0.97% | -7.02% |
ALOT | ALOT AstroNova Inc. | Technology | 11.75 | -2.89% | 86 M | 13.70 | 0.87 | 18.52 | 10.97 | -0.09% | -12.96% |
AINC | AINC Ashford Inc. (Holding Company) | Financial Services | 17.05 | -2.82% | 55 M | -1.80 | -9.31 | 25.99 | 11.72 | -0.55% | 2.40% |
ADVM | ADVM Adverum Biotechnologies Inc. | Healthcare | 1.47 | -2.65% | 147 M | -1.00 | -1.57 | 2.57 | 0.80 | -3.29% | -16.48% |
ASUR | ASUR Asure Software Inc | Technology | 5.60 | -2.61% | 107 M | 51.80 | 0.11 | 9.94 | 5.01 | 8.11% | -28.48% |
ATRI | ATRI Atrion Corporation | Healthcare | 650.90 | -2.22% | 1,143 M | 35.50 | 18.72 | 805.62 | 585.27 | -1.83% | -7.66% |
ARLO | ARLO Arlo Technologies Inc. | Technology | 7.06 | -2.22% | 624 M | -11.60 | -0.64 | 11.79 | 5.52 | -5.11% | -32.70% |
ALRN | ALRN Aileron Therapeutics Inc. | Healthcare | 0.21 | -2.08% | 16 M | -0.70 | -0.29 | 1.27 | 0.13 | 6.05% | -62.34% |
AC | AC Associated Capital Group Inc. | Financial Services | 39.68 | -1.93% | 903 M | -25.60 | -1.59 | 47.50 | 33.69 | -2.36% | -7.72% |
ACET | ACET Aceto Corporation | Healthcare | 15.40 | -1.72% | 338 M | -15.90 | -1.13 | 21.17 | 6.25 | -15.15% | -11.95% |
AJX | AJX Great Ajax Corp. | Real Estate | 10.16 | -1.65% | 234 M | 23.80 | 0.47 | 14.74 | 8.68 | -2.87% | -22.80% |
AGFS | AGFS AgroFresh Solutions Inc. | Basic Materials | 1.84 | -1.60% | 97 M | -2.20 | -0.82 | 2.44 | 1.52 | 0.00% | -7.54% |
AGLE | AGLE Aeglea BioTherapeutics Inc. | Healthcare | 0.49 | -1.58% | 25 M | -0.30 | -1.26 | 8.50 | 0.37 | 15.22% | -89.64% |
APTO | APTO Aptose Biosciences Inc. | Healthcare | 0.82 | -1.57% | 77 M | -1.40 | -0.63 | 3.13 | 0.71 | -4.43% | -39.12% |
AREC | AREC American Resources Corporation | Basic Materials | 2.52 | -1.56% | 165 M | -5.00 | -0.50 | 2.74 | 1.20 | 0.00% | 40.00% |
ASPS | ASPS Altisource Portfolio Solutions S.A. | Industrials | 11.21 | -1.49% | 180 M | 7.40 | 1.58 | 14.58 | 8.07 | -4.60% | -0.09% |
AHPI | AHPI Allied Healthcare Products Inc. | Healthcare | 2.10 | -1.41% | 9 M | -5.40 | -0.47 | 12.15 | 1.55 | -16.67% | -63.92% |
ATY | ATY AcuityAds Holdings Inc | Information | 2.83 | -1.39% | 151 M | 36.70 | 0.07 | 8.69 | 1.65 | 7.60% | -24.73% |
ALKT | ALKT Alkami Technology Inc | Information | 15.66 | -1.39% | 1,376 M | -23.70 | -0.65 | 32.50 | 9.23 | 4.89% | -21.93% |
ALTA | ALTA Alterola Biotech Inc | Industrials | 44.16 | -1.25% | 834 M | 19.00 | 2.36 | 45.22 | 39.11 | ||
ASRV | ASRV AmeriServ Financial Inc. | Financial Services | 3.98 | -1.24% | 67 M | 8.90 | 0.45 | 4.52 | 3.68 | 1.53% | 3.11% |
ACU | ACU Acme United Corporation. | Consumer Defensive | 28.23 | -1.16% | 96 M | 14.20 | 2.26 | 41.96 | 27.22 | -2.04% | -16.23% |
APT | APT Alpha Pro Tech Ltd. | Basic Materials | 4.47 | -1.11% | 58 M | 17.00 | 0.28 | 8.64 | 3.76 | -5.89% | -25.13% |
ATLC | ATLC Atlanticus Holdings Corporation | Financial Services | 37.33 | -1.09% | 573 M | 5.30 | 10.32 | 91.98 | 30.58 | -7.02% | -47.66% |
AUBN | AUBN Auburn National Bancorporation Inc. | Financial Services | 28.00 | -1.06% | 94 M | 12.50 | 2.16 | 37.11 | 25.82 | 3.32% | -13.31% |
AEYE | AEYE AudioEye Inc. | Technology | 6.73 | -1.03% | 72 M | -4.70 | -1.34 | 13.48 | 3.10 | 6.66% | -4.13% |
AATC | AATC Autoscope Technologies Corporation | Manufacturing | 4.97 | -1.00% | 27 M | 23.60 | 0.84 | 8.38 | 4.84 | -1.19% | -20.99% |
AA | AA Alcoa Corporation | Basic Materials | 52.76 | -0.96% | 9,065 M | 9.50 | 5.24 | 98.09 | 36.61 | 8.45% | -11.45% |
AUMN | AUMN Golden Minerals Company | Basic Materials | 0.33 | -0.94% | 53 M | 59.50 | 0.01 | 0.63 | 0.29 | -1.92% | -6.41% |
ATXI | ATXI Avenue Therapeutics Inc. | Healthcare | 0.29 | -0.93% | 6 M | -1.00 | -0.30 | 1.85 | 0.20 | -0.34% | -68.17% |
AEL | AEL American Equity Investment Life Holding Company | Financial Services | 42.29 | -0.82% | 3,809 M | 4.90 | 7.46 | 44.49 | 27.12 | 16.69% | 8.66% |
ASC | ASC Ardmore Shipping Corporation | Industrials | 9.60 | -0.72% | 346 M | -291.30 | -0.03 | 9.83 | 3.07 | 9.84% | 184.02% |
ARMP | ARMP Armata Pharmaceuticals Inc. | Healthcare | 4.22 | -0.71% | 152 M | -4.20 | -1.00 | 6.49 | 2.82 | -0.12% | -22.99% |
ATH | ATH Athene Holding Ltd. Class A | Financial Services | 83.33 | -0.69% | 16,217 M | 4.50 | 19.44 | 91.26 | 61.62 | 0.00% | |
ACER | ACER Acer Therapeutics Inc. | Healthcare | 1.47 | -0.67% | 24 M | -1.10 | -1.39 | 3.77 | 1.16 | -4.55% | -35.53% |
ALIM | ALIM Alimera Sciences Inc. | Healthcare | 6.73 | -0.59% | 47 M | -2.80 | -2.49 | 7.92 | 3.94 | -6.29% | 31.19% |
ARR | ARR ARMOUR Residential REIT Inc. | Real Estate | 7.59 | -0.52% | 877 M | -6.20 | -1.25 | 11.18 | 5.57 | -1.81% | -22.63% |
ATHN | ATHN athenahealth Inc. | Technology | 9.59 | -0.52% | 314 M | -41.20 | 10.89 | 8.74 | |||
ATGE | ATGE Adtalem Global Education Inc. | Consumer Defensive | 37.57 | -0.45% | 1,762 M | 6.00 | 6.52 | 40.60 | 19.14 | -2.42% | 27.10% |
ARKR | ARKR Ark Restaurants Corp. | Consumer Cyclical | 21.75 | -0.41% | 75 M | 6.00 | 3.61 | 22.20 | 14.39 | 2.98% | 29.27% |
APA | APA Apache Corporation | Energy | 34.70 | -0.40% | 10,671 M | 3.60 | 8.92 | 51.95 | 15.55 | 7.73% | 29.04% |
ATIP | ATIP ATI Physical Therapy Inc | Manufacturing | 0.95 | -0.38% | 217 M | -0.20 | -5.56 | 4.63 | 0.91 | -18.66% | -71.93% |
AFIN | AFIN American Finance Trust Inc. | Real Estate | 8.23 | -0.36% | 1,003 M | -28.00 | 9.48 | 7.76 | -9.86% | ||
ADXS | ADXS Advaxis Inc. | Healthcare | 3.38 | -0.29% | 6 M | -0.50 | -6.90 | 4.50 | 3.19 | -6.11% | -12.21% |
AMPE | AMPE Ampio Pharmaceuticals Inc. | Healthcare | 0.10 | -0.29% | 22 M | -1.00 | -0.10 | 1.83 | 0.09 | -4.51% | -81.81% |
ANGO | ANGO AngioDynamics Inc. | Healthcare | 24.23 | -0.29% | 914 M | -34.90 | -0.68 | 32.00 | 17.56 | 2.24% | -12.15% |
ABSI | ABSI Absci Corp | Professional, Scientific, and Technical Services | 4.78 | -0.21% | 362 M | -3.70 | -1.41 | 24.51 | 2.93 | 23.51% | -41.71% |
ARVN | ARVN Arvinas Inc. | Healthcare | 54.46 | -0.15% | 2,969 M | -12.50 | -4.46 | 98.67 | 34.90 | -2.45% | -33.70% |
AFBI | AFBI Affinity Bancshares Inc | Finance and Insurance | 14.63 | -0.14% | 97 M | 15.20 | 0.99 | 18.00 | 13.19 | -2.47% | -5.00% |
AR | AR Antero Resources Corporation | Energy | 40.26 | -0.12% | 11,434 M | 12.10 | 3.08 | 48.80 | 10.91 | 11.77% | 130.06% |
ASTC | ASTC Astrotech Corporation | Industrials | 0.48 | -0.10% | 24 M | -8.10 | -0.16 | 1.21 | 0.42 | -1.07% | -29.15% |
AAWW | AAWW Atlas Air Worldwide Holdings | Industrials | 100.09 | -0.10% | 2,845 M | 6.90 | 16.13 | 101.62 | 58.70 | 0.09% | 6.34% |
ACBI | ACBI Atlantic Capital Bancshares Inc. | Financial Services | 32.34 | -0.09% | 647 M | 13.40 | 2.38 | 33.68 | 22.14 | 12.41% | |
ALSN | ALSN Allison Transmission Holdings Inc. | Consumer Cyclical | 38.77 | -0.08% | 3,608 M | 8.20 | 4.63 | 42.00 | 32.55 | 2.24% | 6.66% |
AMED | AMED Amedisys Inc | Healthcare | 122.36 | -0.07% | 3,876 M | 28.70 | 4.30 | 188.88 | 101.61 | -0.71% | -24.41% |
AAC | AAC AAC Holdings Inc. | Healthcare | 9.88 | 0.00% | 1,235 M | 91.80 | 0.11 | 9.90 | 9.66 | 0.00% | 1.44% |
AAIC | AAIC Arlington Asset Investment Corp | Finance and Insurance | 3.39 | 0.00% | 100 M | -11.00 | -0.29 | 4.04 | 2.88 | 2.73% | -3.14% |
ACC | ACC American Campus Communities Inc | Real Estate | 65.42 | 0.00% | 9,125 M | 130.70 | 0.51 | 65.46 | 48.01 | 0.08% | 14.19% |
ACIW | ACIW ACI Worldwide Inc. | Technology | 26.13 | 0.00% | 2,949 M | 19.90 | 1.31 | 36.01 | 23.63 | 0.81% | -24.70% |
ACRS | ACRS Aclaris Therapeutics Inc. | Healthcare | 16.80 | 0.00% | 1,177 M | -13.40 | -1.34 | 19.97 | 9.26 | -6.67% | 15.54% |
AESE | AESE Allied Esports Entertainment Inc | Arts, Entertainment, and Recreation | 1.57 | 0.00% | 61 M | 1.00 | 1.56 | 2.50 | 1.20 | 1.30% | -8.19% |
AFIB | AFIB Acutus Medical Inc. | Manufacturing | 1.66 | 0.00% | 43 M | -0.30 | -4.50 | 13.80 | 0.48 | 7.79% | -51.32% |
AGM.A | AGM.A AGM.A | 110.37 | 0.00% | 1,155 M | 9.60 | 11.21 | 124.37 | 87.50 | 2.95% | -8.02% | |
AKU | AKU Akumin Inc | Health Care and Social Assistance | 0.77 | 0.00% | 60 M | -0.80 | -0.87 | 2.87 | 0.46 | 17.50% | -56.00% |
AMTBB | AMTBB Amerant Bancorp Inc. Class B Common Stock | Financial Services | 28.72 | 0.00% | 1,090 M | 19.40 | 1.48 | 29.05 | 19.50 | ||
AMTI | AMTI Applied Molecular Transport Inc. | Manufacturing | 1.96 | 0.00% | 71 M | -0.50 | -3.49 | 33.28 | 1.71 | 4.26% | -85.98% |
ANAT | ANAT American National Insurance Company | Financial Services | 190.02 | 0.00% | 5,109 M | 8.00 | 23.74 | 195.89 | 187.10 | 0.00% | 0.62% |
ANGN | ANGN Angion Biomedica Corp | Manufacturing | 1.03 | 0.00% | 31 M | -1.00 | -1.01 | 13.66 | 0.98 | -1.90% | -64.48% |
ARDS | ARDS Aridis Pharmaceuticals Inc. | Healthcare | 2.31 | 0.00% | 39 M | -0.70 | -3.79 | 4.34 | 0.88 | 0.87% | -0.86% |
ARNA | ARNA Arena Pharmaceuticals Inc. | Healthcare | 99.99 | 0.00% | 6,165 M | -9.90 | -9.69 | 100.00 | 45.50 | 7.59% | |
ASRT | ASRT Assertio Therapeutics Inc. | Healthcare | 3.80 | 0.00% | 174 M | 52.10 | 0.06 | 4.44 | 0.85 | 4.11% | 74.31% |
ATRS | ATRS Antares Pharma Inc. | Healthcare | 5.59 | 0.00% | 955 M | 25.30 | 0.24 | 5.60 | 3.11 | 0.00% | 56.58% |
Get Access to 1 Billion Usable Market data points IN YOUR EXCEL SHEETS WITH EASY TO USE EXCEL FUNCTIONS
Get started todayStand with Ukraine
As the situation in Ukraine escalates, many of us in MarketXLS are left with emotions too overwhelming to name. If you’d like to show your support, but aren’t sure how to, we want to help make it easier for you to act.
For any amount donated, we’ll extend your MarketXLS subscription for double of the donated amount. Please send proof of your payment to support@marketxls.com to avail the extention
From all of us at MarketXLS, thank you!