Elliott Wave Theory – A Brief Introduction

Meet The Ultimate Excel Solution for Investors
- Live Streaming Prices Prices in your Excel
- All historical (intraday) data in your Excel
- Real time option greeks and analytics in your Excel
- Leading data in Excel service for Investment Managers, RIAs, Asset Managers, Financial Analysts, and Individual Investors.
- Easy to use with formulas and pre-made sheets
A Bit of History
In the early 1930s Ralph Nelson Elliott began an in-depth study of stock market price data from the previous 75 years. An accountant by trade, he had already lived as an expat in Mexico, run a successful consulting business in New York, served as Chief Accountant for Nicaragua as an appointee of the US State Department, and written books on two rather disparate topics: tea room management, and the future of Latin America. He had also, in 1929 at the age of 58, declared bankruptcy as a result of medical bills from a gastrointestinal illness contracted in Central America. That illness had left him unable to work for a period of time, compounding his financial distress. The stock market crash did not help the situation.
Looking for a fresh start, he created and studied charts showing price movements, over various time frames, for the Dow Jones Industrial Average. He was looking for patterns. He already held the idea that human behavior was driven in large part by the movements between optimism and pessimism, and that those movements occurred in cycles. Since stock markets were driven in part by sentiment, could those cycles apply to the stock market? Could they be identified? And did they have predictive value?
Over time, Elliott determined that price movements occurred in waves. For a more in depth look at the waves, see Elliott Wave Theory – Understanding the Waves.
Fractal Nature and Degree

Fractals are geometric structures that appear the same whether you zoom in or zoom out. They occur everywhere in nature: the shape of a coastline, the structure of a branching tree, the way romanesco broccoli is made (see image above). The overall structure is repeated in the smaller degree structures from which it is made.
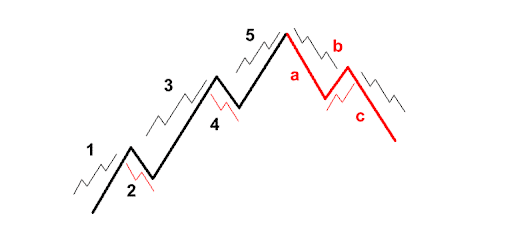
According to Elliott, in a stock chart the basic pattern is 5 waves in the dominant direction (1 – 5 in dark black below), then 3 waves in the corrective direction (a – c in red). But these waves do not move in a straight line. At any degree, or at any time frame, the same 3 or 5-wave pattern can be found. In the image below you can see that dominant wave 1 is divided into a smaller 5-wave movement. Wave 2 is further divided into a smaller 3-wave movement, and so on. These sub waves could also be further subdivided. When you look at a long-term price chart, perhaps a 10 or 20 year chart, and see the overall wave pattern, you can then zoom in and look at one year or one month within that time frame, and see a similar pattern within the larger one. At any time frame (or degree), you will find similar wave structures. Thus, we can say that the charts have a fractal nature.
Fibonacci Ratios and Retracements
The series of numbers 0, 1, 1, 2, 3, 5, 8, 13, 21, 34, 55, 89, 144 and so on, where each number is the sum of the 2 previous numbers, is called the Fibonacci series, and is credited to the 12th century Italian mathematician Fibonacci (although there is evidence it had existed in Indian mathematics at least 500 years prior). Fibonacci numbers get interesting when you divide each one by the previous one. For example, 1 / 1 = 1, 2 / 1 = 2, 3 / 2 = 1.5.
If you keep dividing, you notice that the quotients begin oscillating around, and getting closer to, 1.618.
1, 2, 1.5, 1.666…, 1.6, 1.625, 1.615…, 1.619…, 1.6176…, 1.6181…, 1.6179…
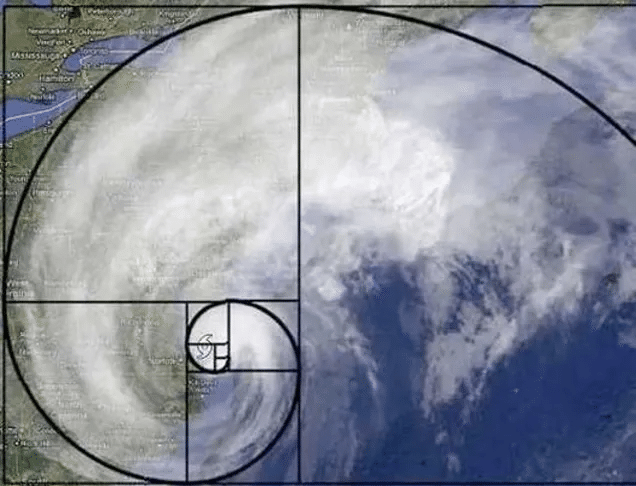
If that number sounds familiar, you may recall it is the golden ratio. The golden ratio occurs throughout nature, from various proportions in the human body, to the degree of curvature of a hurricane or the structure of a beehive. It is used extensively in art and architecture. A rectangle that respects the golden ratio is quite pleasing to the eye.
Similarly, you can divide each number by the next one, and the quotients will approach 0.618. Or divide each number by the one that occurs 2 positions later, and the quotients will approach 0.382. And dividing each number by the one that occurs 3 positions later, results in quotients approaching 0.236.
Elliott found that these ratios occurred in charts for the Dow Jones Industrial Average frequently. For example, using the wave image earlier in this article, wave 2 down may “retrace” 38.2% of the distance of wave 1 up.
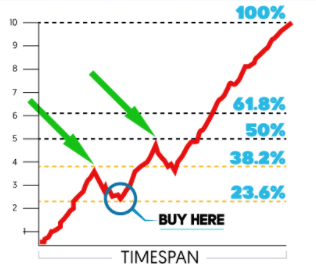
In the chart below, the price has moved from 0 to 100% over the “Timespan” shown. The movement was in 5 waves….up to 38.2%, back down to the 23.6% level, up to 50% (not a Fibonacci ratio, but a ratio that is commonly seen in price movements), back to 38.2% and then on up in a strong 5th wave. Obviously this is much easier to measure in hindsight!
Universal Laws of Nature?
Elliott came to believe his waves represented universal laws that could be applied to everything, including human behavior. This belief culminated in the writing and publication of Nature’s Law – The Secret of the Universe in 1946. Although this book mentions a variety of areas where the laws can be applied, the focus was on finding the probable direction, degree, and timing of stock price movements.
Does it Work?
Elliott Wave Theory is a useful tool when predicting market direction and, to a certain extent, timing. It seems to be more reliable when used to predict the broad market indices such as the Dow Jones Industrial Average or the S&P 500 Index. It is less reliable when applied to individual stocks.
It’s relatively easy to learn the basics, but to use it proficiently in trading, one needs a fairly comprehensive grasp of the subject, and many people give up before they get there. The biggest challenge is in how to apply it. For example, even if you figure out which wave the market is currently in, you still need to determine the amplitude of the wave and the timing for when it will change direction. Experienced Elliott Wave technicians will seek confirmation from monthly, weekly, and daily charts before predicting trends. Day traders would look at the hour and minute charts to figure out just where along the wave structure the market actually is, where it will go next, and when. A gifted technician can find the more probable outcomes and that can give them an edge.
References
Wikipedia.com
Investopedia.com
Protrader.org
Thismatter.com
Elliottwavetrader.net
Disclaimer
All trademarks referenced are the property of their respective owners. Other trademarks and trade names may be used in this document to refer to either the entity claiming the marks and names or their products. MarketXLS disclaims any proprietary interest in trademarks and trade names other than its own, or affiliation with the trademark owners.
None of the content published on marketxls.com constitutes a recommendation that any particular security, portfolio of securities, transaction, or investment strategy is suitable for any specific person. The author is not offering any professional advice of any kind. The reader should consult a professional financial advisor to determine their suitability for any strategies discussed herein. The article is written for helping users collect the required information from various sources deemed to be an authority in their content. The trademarks if any are the property of their owners and no representations are made.

I invite you to book a demo with me or my team to save time, enhance your investment research, and streamline your workflows.