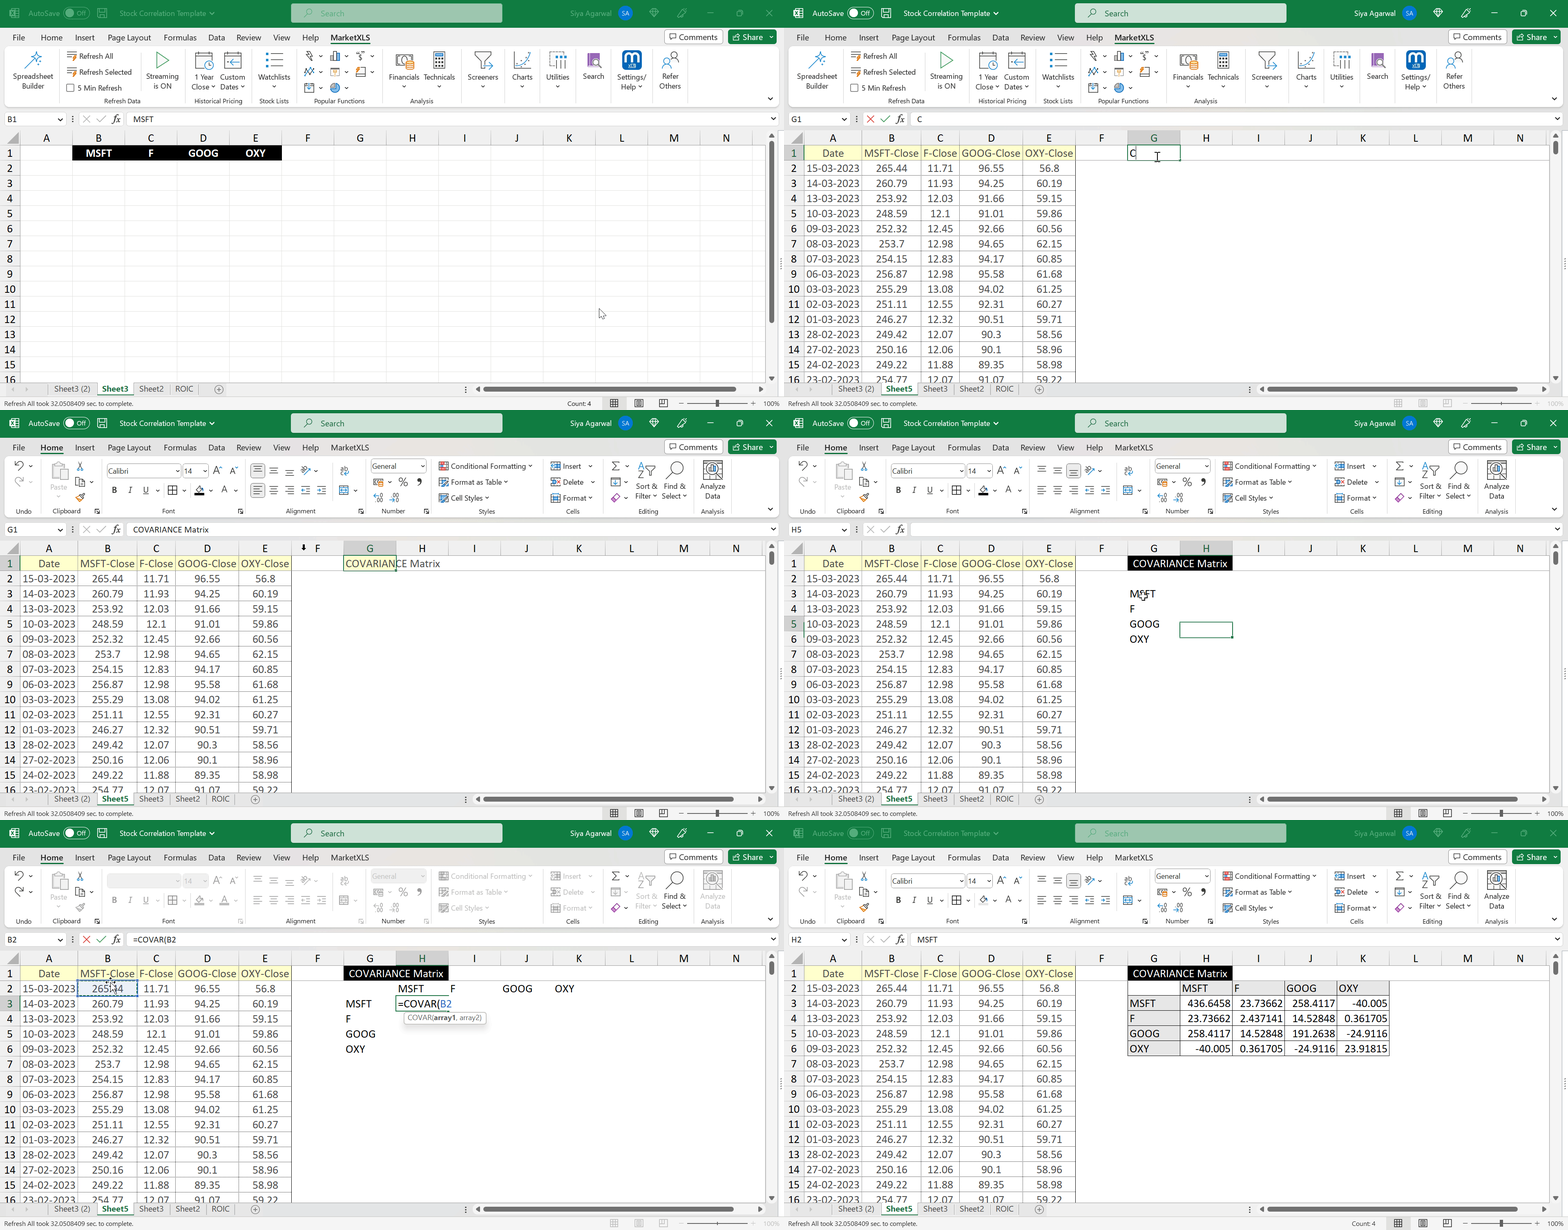
Improve Portfolio Strategy by Checking Covariance Among Two Stocks
Covariance analysis is a vital tool in portfolio management, providing insights into the degree to which two stocks move together. It is a measure of the relationship between two stocks, ranging from no relationship to high covariance. Understanding covariance is crucial in analyzing the risk associated with holding multiple stocks in a portfolio, and investors should aim for low correlation to diversify their portfolios effectively. By monitoring the covariance of two stocks, investors can make informed decisions about which stocks to include in their portfolios to minimize risk and maximize returns. MarketXLS provides a simple and efficient way of checking covariance among two stocks, making it easier for investors to make data-driven decisions for their portfolio management.
Impact of Covariance on Portfolio Returns
Checking covariance among two stocks is essential in constructing and managing a portfolio. Covariance measures the relationship between two securities and determines portfolio risk and expected return. High positive covariance indicates a likelihood of both assets increasing together, leading to higher portfolio returns. Conversely, high negative covariance leads to a lower return and increased portfolio volatility. Therefore, understanding covariance is crucial in making informed investment decisions and maximizing portfolio returns.
Mathematically, the covariance between two variables X and Y is defined as the expected value of the product of the deviations of each variable from its mean:
cov(X,Y) = E[(X – E[X]) * (Y – E[Y])]
where E[X] and E[Y] are the expected values (means) of X and Y, respectively.
How MarketXLS Can Help with Checking Covariance Among Two Stocks?
MarketXLS is a powerful tool that can help investors, traders, and financial professionals increase their efficiency and effectiveness in stock market analysis. It is a combination of a stock research spreadsheet and a stock market data platform. It provides users with a wide range of features such as financial data analysis, charting, and screeners. The user has access to a vast array of real-time market information, such as quotes, news, and ETFs. Additionally, one can access a wide range of resources, including technical analysis and sentiment indicators. MarketXLS can help users save time and effort when performing research, allowing them to make more informed decisions quickly.
Conclusion
In summary, understanding covariance and checking covariance among two stocks is essential for effective portfolio management. By monitoring covariance, investors can make informed decisions about which stocks to include in their portfolios, minimizing risk, and maximizing returns. With MarketXLS, investors have access to a comprehensive set of tools to help them analyze covariance and build more diversified and profitable portfolios.
Invest Smarter: Use an Efficient Frontier Calculator

