Get EOD data for Major US Indices – MarketXLS New Release 9.3.4.9
With great excitement, we announce the release of MarketXLS Version 9.3.4.9.##** Key Updates Summary:--Next Expiration & Next Strikefunctions give the next expiration date or strike for an underlying. Example,=ExpirationNext(“MSFT”,1)**if today’s 22nd June 2023 (Wednesday) it will show the 23rd June 2023 expiration date.
- AddedEOD datafor these Indices** CBOE Volatility Index , S&P 500 Index , NASDAQ Composite Index, Dow Jones Industrial Average , NASDAQ-100 Index.-Performance Enhancements## Here are the new updates:-###1) ** Next Expiration & Next Strike functions can be used to get the next expiration date or strike of a symbol.The“ExpirationNext”and“StrikeNext”functions in MarketXLS help users retrieve information about thenextexpiration date and strike for a given underlying. Here’s how you can use the ExpirationNext function:
=ExpirationNext(“MSFT”,1): This formula will return the next expiration date for the symbol. Example if today’s 22nd June 2023 (Wednesday) it will show the 23rd June 2023 expiration date.
** Here’s how you can use the StrikeNext function:**
=StrikeNext(“MSFT”,1): This formula will return the first above-the-money strike price for a call option, Example if the current strike price is 350 it will show 357.5 and so on.
=StrikeNext(“MSFT”,-1): This formula will return the first below-the-money strike price for a call option, Example if the current strike price is 350 it will show 352.5 and so on.
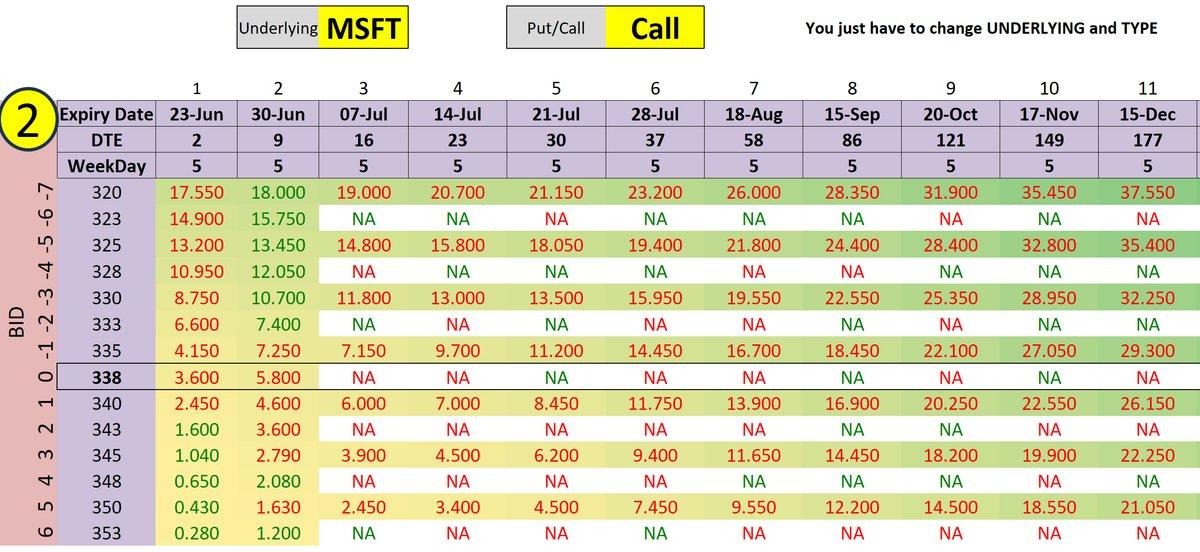
Two use cases have been provided below using **Option MatrixandOption Chain**templates.

Option Matrix Template

Option Chain Template
###2) We have added indices data for the past 5 years for the following symbols: ‘^VIX’, ‘^SPX’, ‘^IXIC’, ‘^DJI’, and ‘^NDX’.The latest release of MarketXLS now includes End-of-Day (EOD) data for five major indices: CBOE Volatility Index (‘^VIX’), S&P 500 Index (‘^SPX’), NASDAQ Composite Index (‘^IXIC’), Dow Jones Industrial Average (‘^DJI’), and NASDAQ-100 Index (‘^NDX’).You can utilize MarketXLS functions such aslast price, close price, technical indicators, historical data, and stock return functionsto gain valuable insights and make informed investment decisions based on the data for these indices.
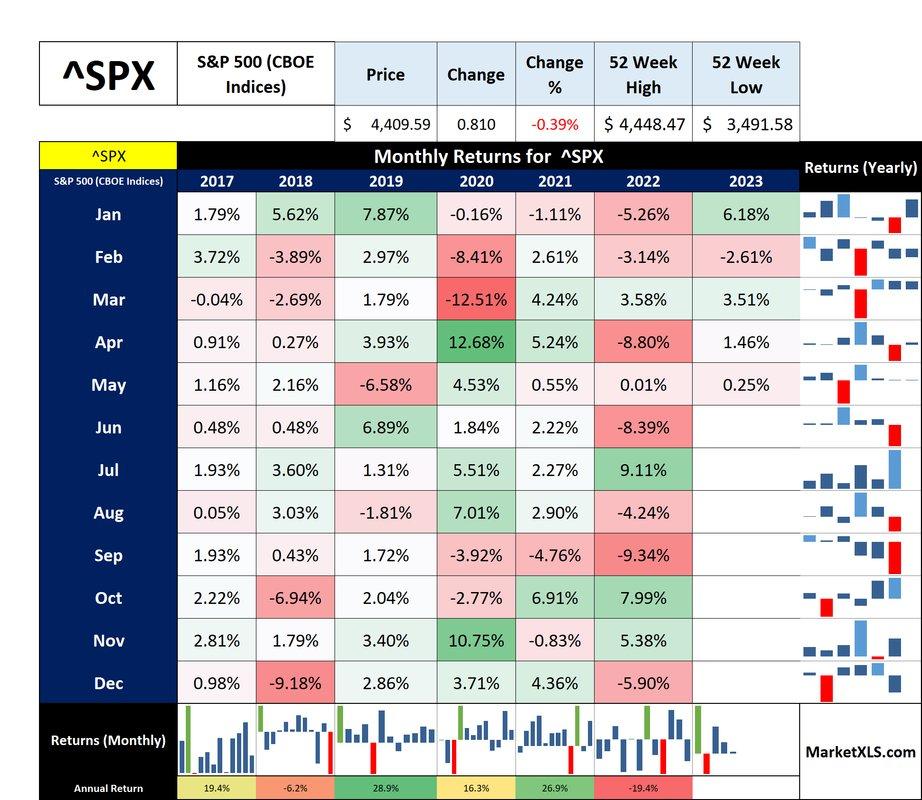
Using this we updated the seasonality of SPX below (month-on-month)Click here to Download the Template.

Seasonality returns Template
###**3) Performance Enhancement **In this build, we have implemented performance enhancement optimizations. This version is designed to address all speed-related and OLE-based errors that users encountered previously.
Our team has also performedminor optimizationsto run MarketXLS smoothly. Please email us atsupport@marketxls.comwith any concerns or issues you face.
Click here to join ourDiscord ** community** and engage with other MarketXLS users.
MarketXLS focuses on delivering the best Excel experience to its users; help us improve MarketXLS by sharing your feedback.
