Home MarketXLS
Dashboard MarketXLS
Screener MarketXLS
Options Profit Calculator MarketXLS
Stock Ranks MarketXLS
Spreadsheet Builder MarketXLS
Documentation MarketXLS
Logout MarketXLS

Guru Screen Functions in MarketXLS – New Feature In Our Latest Update!

Written by Ansh Thakkar (Individual Contributor) on 
Thu Jun 24 2021
 about Guru functionsHow to use MarketXLS
Guru Screen Functions in MarketXLS – New Feature In Our Latest Update!
Boost your market advantage with MarketXLS. Real-time, enterprise-grade data. Book a demo or subscribe now!
Guru Screen Functions in MarketXLS – New Feature In Our Latest Update!

Guru Screen Functions are used to filter out stocks based on the winning investment strategies of stock market legends such as Warren Buffet, Benjamin Graham, Robert Piotroski etc. They are a part of MarketXLS since its foundation has been laid down. These screens are of immense value to the customers and users of MarketXLS. These screens are naturally embedded with hundreds of years of acumen and experience in stock market. A company needs to meet specific predetermined criteria and certain parameters to be accepted on these screens. They aid in quick decision-making.
The software previously had separate templates for each guru screen. The users had to enter their various requirements. The analysis of stocks using these guru screens used to be a slightly lengthy procedure. However, in our latest update, we have mutated and simplified these screens. Each template has been converted into single ready-to-use function. This article will provide a brief description on these guru screen functions.

What’s New?

In this release, we have added many advanced Guru Screen functions. There are 17 new guru screen functions in this update.
Here is a list of Guru Screen functions MarketXLS is offering in this new release:
=gs_Buffettology_EPS_Growth()
=gs_Foolish_Small_Cap_8_Screen()
=gs_Graham_Defensive_Investor_Non_Utility_Screen()
=gs_Graham_Defensive_Investor_Utility_Screen()
=gs_Graham_Enterprising_Investor_Revised()
=gs_Kirkpatrick_Value_Screen()
=gs_Lynch_Screen()
=gs_Murphy_Technology_Screen()
=gs_O_Shaughnessy_Small_Cap_Growth_And_Value_Screen()
=gs_O_Shaughnessy_Tiny_Titans_Screen()
=gs_Oberweis_Octagon_Screen()
=gs_Walter_Schloss_New_Lows_Screen()
=gs_Wanger_Revised_Screen()
=gs_Weiss_Blue_Chip_Div_Yield_Screen()
=gs_Templeton_Screen()
=gs_T_Rowe_Price_Screen()
=gs_Zweig_Screen()

You might have noticed that all the functions start with the letter “gs”. The letters “gs” are the abbreviation of the words guru screen. The significance behind using these two words is that it helps the user in easy identification of functions. All the functions starting with “gs” fall under the category of guru screen functions.
These ready-to-use functions pull the data of all those stocks which match with the criteria of the respective screens. This facilitates in easy comparison of stocks. It also helps in easier identification of new good stocks. We will learn about this feature in the step-by-step procedure given in the following section of this blog.
In this article, we will be looking at one of the guru screen functions and how to use it in MarketXLS.
We will be taking the example of Zweig Screen to explain the steps of using these guru screen functions.
The strategy for Zweig Screen given by the investment advisor Martin Zweig is based on identifying companies with strong growth in earnings and sales. For a stock to meet the Zweig Screen check, it must meet many earnings-related criteria, which indicate potential earnings growth at a high rate in the long term. This means it should be consistent over several consecutive years, has accelerated in recent quarters, and is sustainable.
For more details visit: https://marketxls.com/zweig-screen-parameters-analysis/

Step-by-step procedure of using MarketXLS to perform analysis on stocks using guru screens

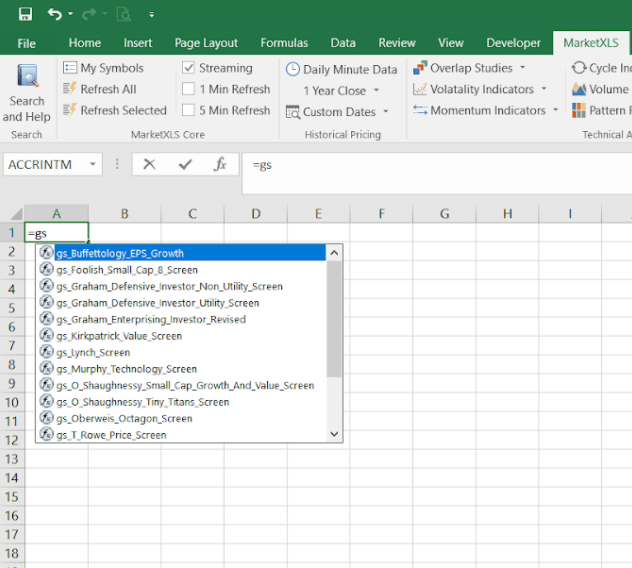
Step 1: Open a new excel workbook and enter the formula of the Zweig Screen function as shown in the image below. You can see, as you type “=gs”, a list of guru screen functions automatically appear in the built-in drop-down suggestion list of functions of excel. Thus, MarketXLS provides you with a wide range of options to select from to perform analysis on stocks.

List of Guru Functions

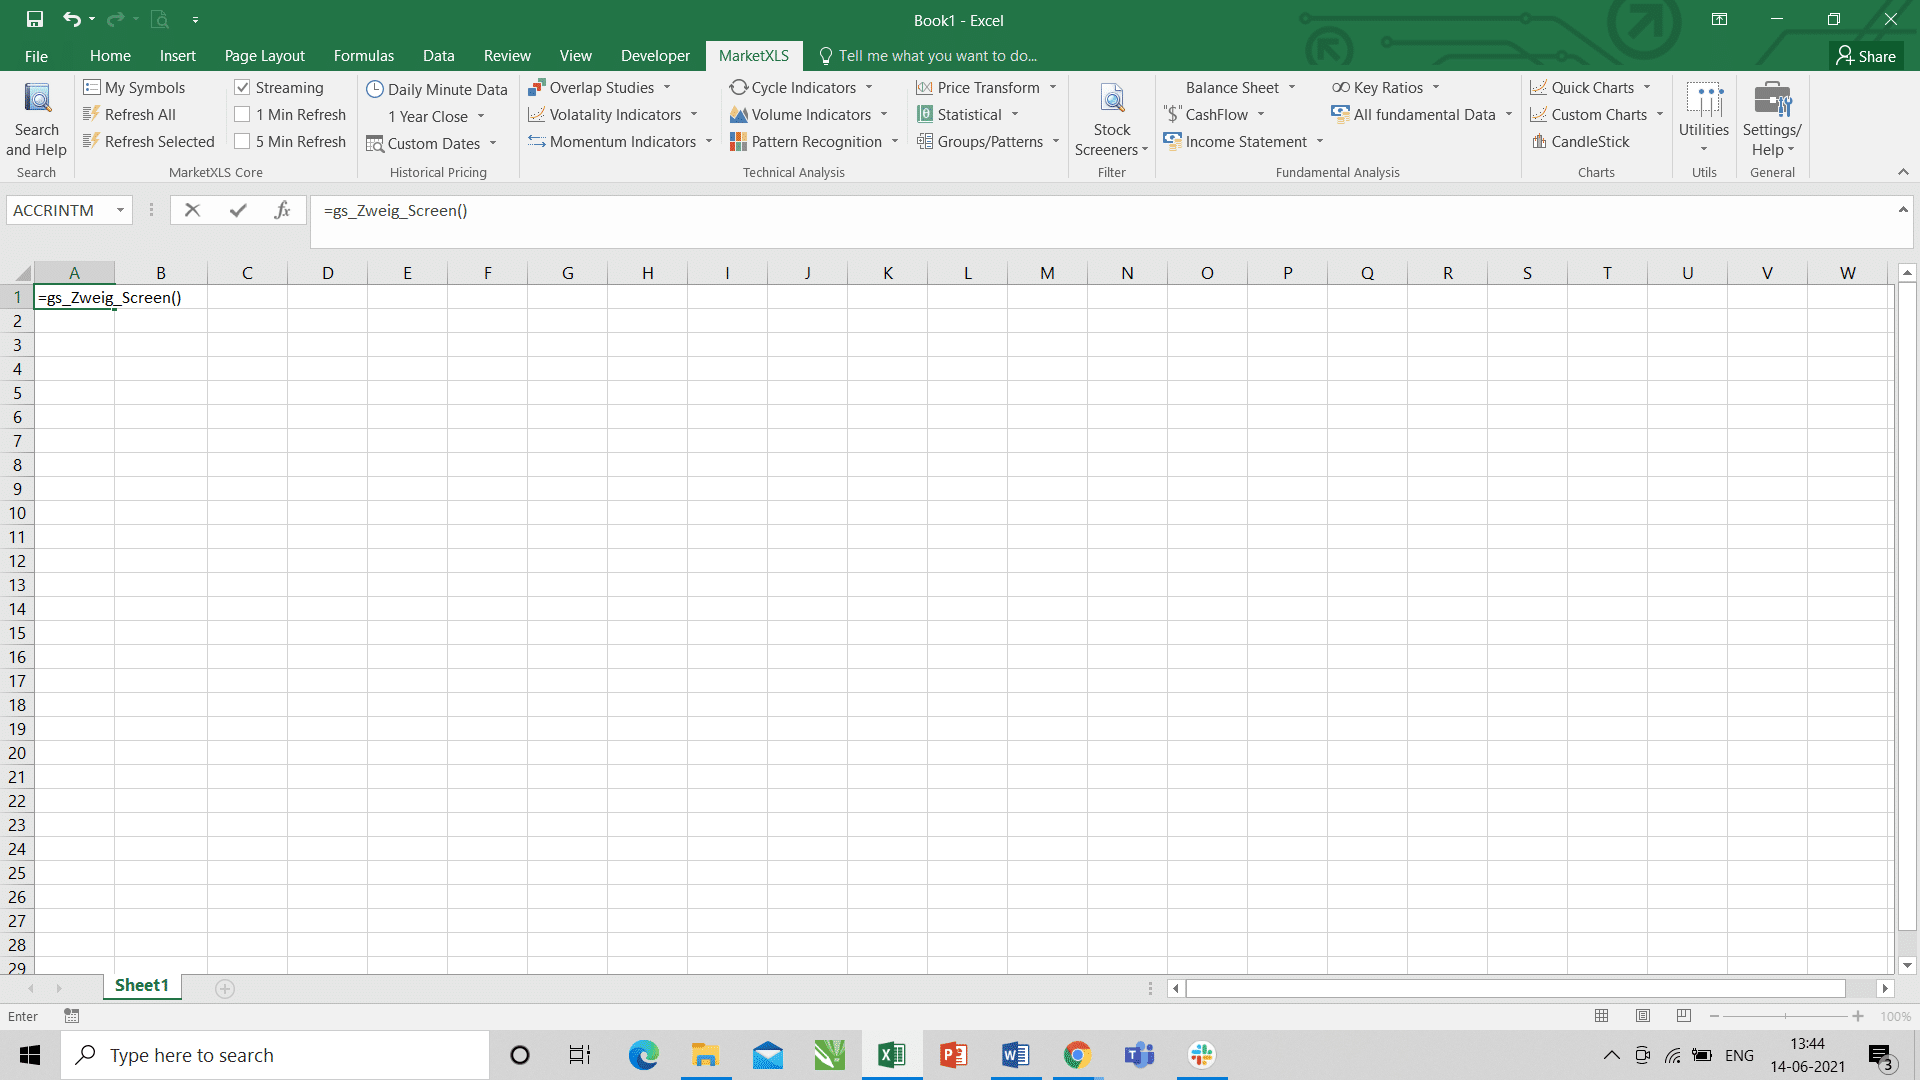
Step 2: Enter the formula of Zweig Screen – “=gs_Zweig_Screen” or select the function of Zweig Screen from the drop-down list. Open and close the parenthesis without entering any values in between them. The software will automatically pull the values, criteria and parameters of the screen.

Zweig Screen

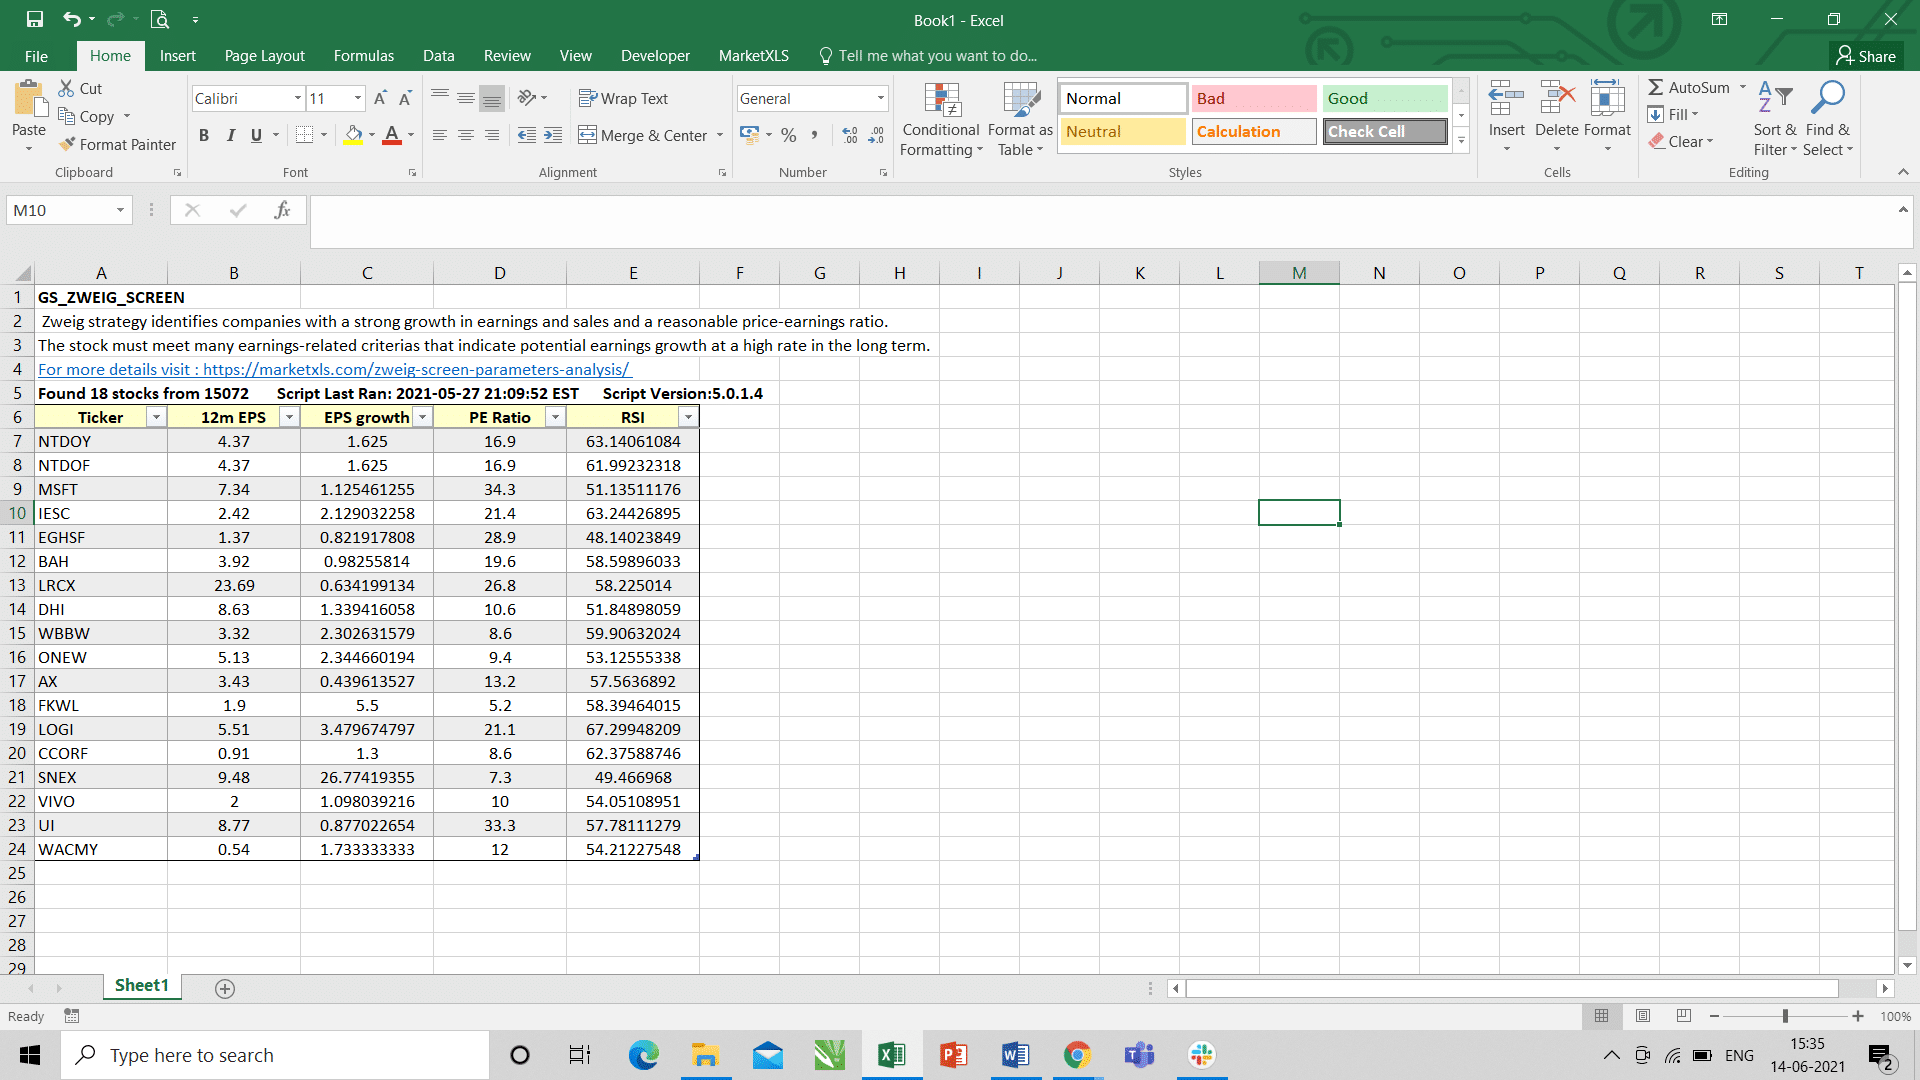
Step 3: The software pulls the data of all the stocks whose parameters match with the criteria of the screen. In this case, the software has pulled 18 stocks out of 15072 stocks. These 18 stocks match with the criteria set by the Zweig Screen.

Zweig Screen Function

How to find whether a particular stock falls under the criteria of the Guru Screen or not?

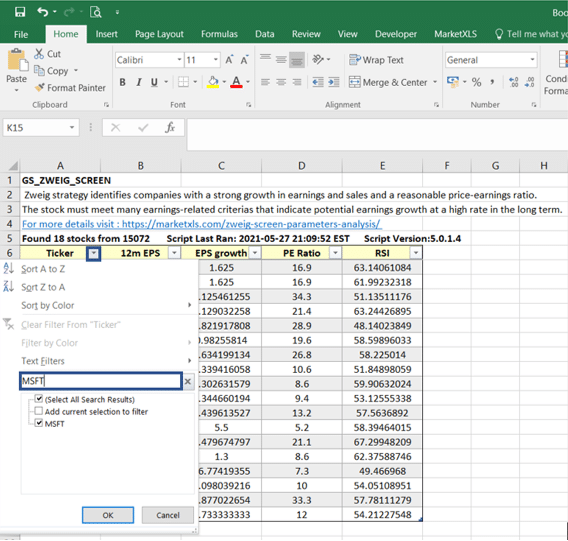
Step 4: This will help you to ascertain whether the stocks, which you are looking for, are accepted by the Zweig Screen or not. You can search for the stock ticker, which you are looking for, in the filter dropdown provided. If you find the ticker available in the dropdown, that particular stock is accepted by the screen. For example, in this case, we searched the ‘MSFT’ stock in the filter dropdown, and we found it. This means that the Zweig Screen accepts the Microsoft stock. You can apply the same procedure for other stocks and other screens.
(These functions should not be considered as an advertisement or advice, professional or otherwise. You are requested to consider all the risk factors, including your financial condition, suitability to risk-return profile, and other similar conditions. These functions do not account for any professional advice but are merely some guidelines to explain the concept.)

Filtering stocks

Disclaimer

None of the content published on marketxls.com constitutes a recommendation that any particular security, portfolio of securities, transaction, or investment strategy is suitable for any specific person. These templates should not be considered as an advertisement or advice, professional or otherwise. You are requested to consider all the risk factors, including your financial condition, suitability to risk-return profile, and other similar conditions. These templates do not account for any professional advice but are merely some guidelines to explain the concept. The author is not offering any professional advice of any kind. The reader should consult a professional financial advisor to determine their suitability for any strategies discussed herein.
The article is written to help users collect the required information from various sources deemed to be an authority in their content. The trademarks, if any, are the property of their owners, and no representations are made. All trademarks referenced are the property of their respective owners. Other trademarks and trade names may be used in this document to refer to either the entity claiming the marks and names or their products. MarketXLS disclaims any proprietary interest in trademarks and trade names other than its own or affiliation with the trademark owner.

Image Source

TCIiNgpDMlvECFQAAAAAdAAAAABAP”>https://www.google.com/url?sa=i&url=https%3A%2F%2Fwww.businessinsider.com%2Fstock-market-rally-jpmorgan-2-charts-that-are-signaling-big-rebound-2019-1&psig=AOvVaw3vIYhnCNHgPuQBfJbmZhf2&ust=1623741891385000&source=images&cd=vfe&ved=0CA0QjhxqFwoTCIiNgpDMlvECFQAAAAAdAAAAABAP

Interested in building, analyzing and managing Portfolios in Excel?
Download our Free Portfolio Template
I agree to the MarketXLS Terms and Conditions
Call: 1-877-778-8358
Ankur Mohan MarketXLS
Welcome! I'm Ankur, the founder and CEO of MarketXLS. With more than ten years of experience, I have assisted over 2,500 customers in developing personalized investment research strategies and monitoring systems using Excel.

I invite you to book a demo with me or my team to save time, enhance your investment research, and streamline your workflows.
Implement “your own” investment strategies in Excel with thousands of MarketXLS functions and templates.

MarketXLS is a complete Excel stock solution

Kevin Hsu

StockKevin.com

I have used lots of stock and option information services. This is the only one which gives me what I need inside Excel

Lloyd Lenase

Option Day Trader

MarketXLS is a data junkie’s dream. It gives me the flexibility to mine for hidden treasures.

Dave

Swing trader since 2011

I like to access historical closing prices on a particular date. That makes tracking performance easy.

Patrick Cusatis, Ph.D., CFA

Associate Professor of Finance - Penn State University

Get Access to 1 Billion Usable Market data points IN YOUR EXCEL SHEETS WITH EASY TO USE EXCEL FUNCTIONS

Get started today

🎉 Exciting news! 🎉

You are invited to join our Discord Channel.

Interact, learn, and grow with experts in the markets!

Join our Discord